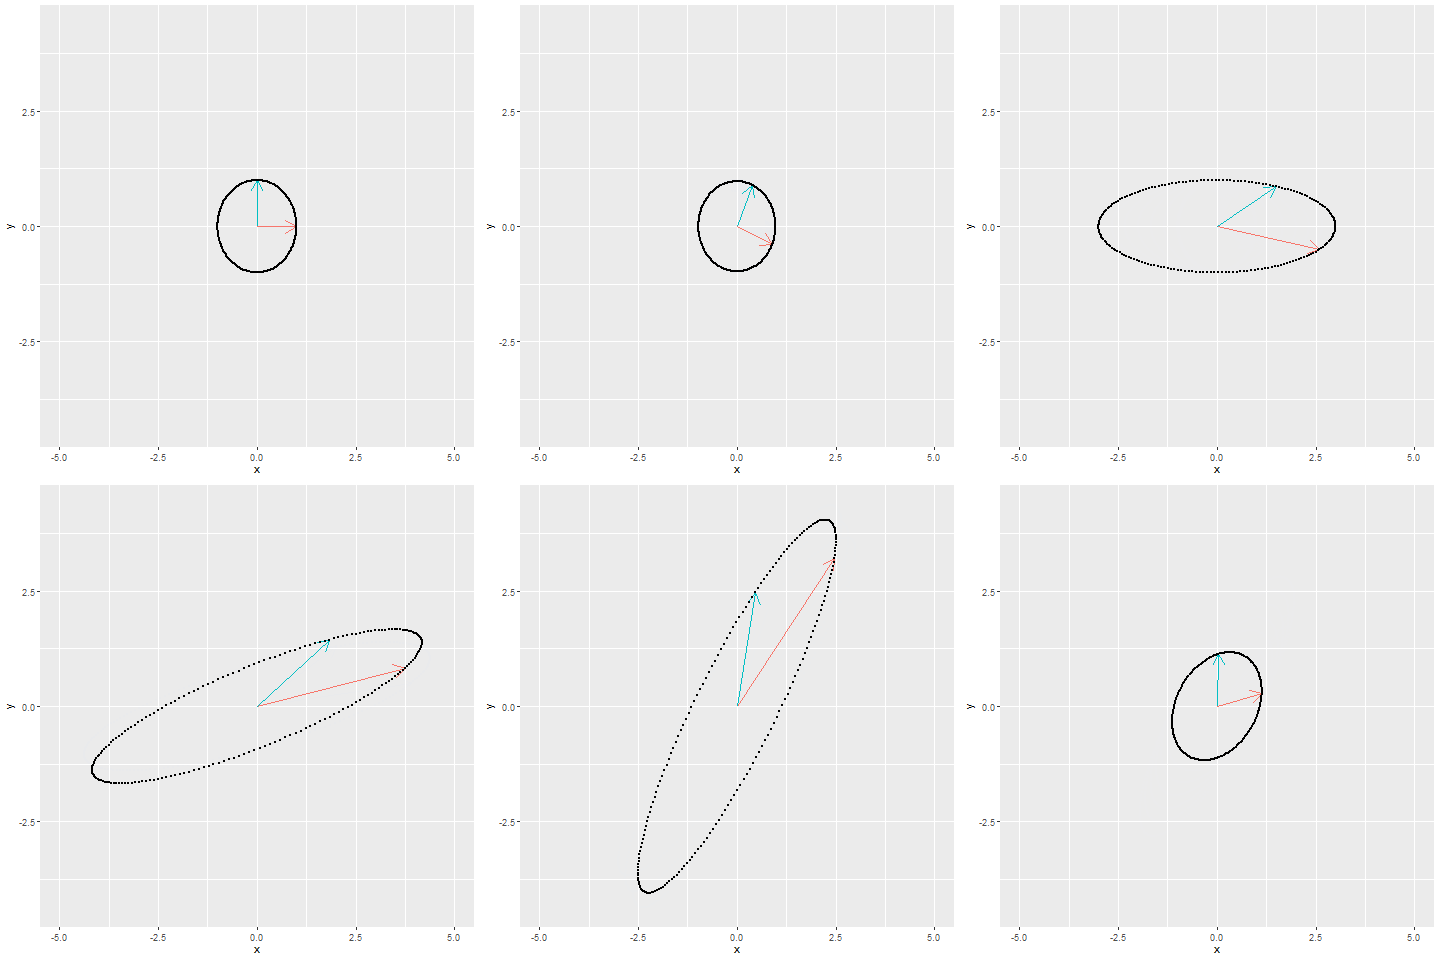
library(gganimate)
library(gifski)

# 构造数据
phi<-pi/6
theta<-pi/3
c<-matrix(c(cos(phi),sin(phi),-sin(phi),cos(phi)),
          nrow=2,byrow=TRUE)
b<-matrix(c(5,0,0,1),nrow=2,byrow=TRUE)
a<-matrix(c(cos(theta),-sin(theta),sin(theta),cos(theta)),
          nrow=2,byrow=TRUE)
A<-a%*%b%*%c
A

x<-matrix(c(1,0,0,1),nrow=2,byrow=TRUE)
rotate1<-c%*%x
stretch<-b%*%c%*%x
rotate2<-a%*%b%*%c%*%x
svd_trans<-cbind(x,rotate1,stretch,rotate2)
df1<-data.frame(t=c(1,1,2,2,3,3,4,4),
                x1=c(0,0,0,0,0,0,0,0),
                y1=c(0,0,0,0,0,0,0,0),
                x2=svd_trans[1,],
                y2=svd_trans[2,],
                point=c('A','B','A','B','A','B','A','B'))

Points<-matrix(c(cos(seq(0,2*pi,0.01*pi)),
                 sin(seq(0,2*pi,0.01*pi))),
               byrow=TRUE,nrow=2)
Points_rotate1<-c%*%Points
Points_stretch<-b%*%c%*%Points
Points_rotate2<-a%*%b%*%c%*%Points
Points_svd<-cbind(Points,Points_rotate1,Points_stretch,Points_rotate2)
df2<-data.frame(Points_x=Points_svd[1,],
                Points_y=Points_svd[2,],
                t=rep(c(1,2,3,4),each=ncol(Points)))

# 绘制图形
p<-ggplot()+
  geom_segment(data=df1,aes(x=x1,y=y1,xend=x2,yend=y2,color=point),
               arrow=arrow(length = unit(0.03, "npc")))+
  geom_point(data=df2,aes(x=Points_x,y=Points_y),size=0.01)+
  labs(x=expression(x),y=expression(y))+
  theme(legend.position="none")+
  transition_states(t)
animate(p, renderer = gifski_renderer())


