【机翻】Reverse Engineering Call Of Duty Anti-Cheat 逆向工程《使命召唤》反作弊系统
【机翻】Reverse Engineering Call Of Duty Anti-Cheat 逆向工程《使命召唤》反作弊系统
原文:逆向工程 Call Of Duty 反作弊 // ssno --- Reverse Engineering Call Of Duty Anti-Cheat // ssno
Jan 4, 2025 2025 年 1 月 4 日
39 min read
- 【机翻】Reverse Engineering Call Of Duty Anti-Cheat 逆向工程《使命召唤》反作弊系统
- Arxan
- Runtime Executable Decryption 运行时可执行文件解密
- Executable Checksums 可执行文件校验和
- Jmp Obfuscation 跳转混淆
- Entrypoint Obfuscation 入口点混淆
- Pointer Encryption 指针加密
- Runtime API Export Lookup 运行时 API 导出查找
- How can we figure out what these hashes are? 我们怎么找出这些哈希是什么?
- Debug Registers 调试寄存器
- Here’s how TAC checks for debug registers. TAC 是如何检查调试寄存器的。
- Driver Signing Enforcement 驱动程序签名强制执行
- How does TAC exit the process? TAC 是如何退出该过程的?
- Detecting Cheat Logging 检测作弊记录
- Detecting Visuals 检测视觉内容
- What about External Cheats? 关于外部作弊怎么办?
- What about tools like Cheat Engine? 像 Cheat Engine 这样的工具怎么样?
- Anti-Sig Scanning 反签名扫描
- Anti-Debugging 反调试
- Monitoring Network Traffic 监控网络流量
- Encrypted Custom Syscalls 加密自定义系统调用
- Detecting Anti-Debugger-Hiding Attempts 检测反调试隐藏尝试
- Create Remote Thread Blocking 创建远程线程阻塞
- Dumping Exception Handlers 抛出异常处理程序
- Mystery Tech?
- The End
Anticheat 反作弊Reverse Engineering 逆向工程
Interested in Anti-Cheat analysis? I highly recommend checking out Guided Hacking’s Anti-Cheat section.
对反作弊分析感兴趣吗?我强烈推荐查看 Guided Hacking 的反作弊部分。
I’ve been reversing Black Ops Cold War for a while now, and I’ve finally decided to share my research regarding the user-mode anti-cheat inside the game. It’s not my intention to shame or promote cheating/bypassing of the anti-cheat, so I’ve redacted a few things.
我一直在逆向工程《现代战争冷战》这款游戏,并最终决定分享我对游戏内部用户模式反作弊系统的研究。我的本意不是要羞辱或推广作弊/绕过反作弊的行为,因此我已经省略了一些内容。

To clear up any confusion, Black Ops Cold War does not have the kernel-mode component of Ricochet that Modern Warfare (2019) and later titles have. I’ll be referring to the anti-cheat as TAC (Treyarch Anti-Cheat) as the game I reversed is a Treyarch game. Also, whenever I provide function pseudocode, it will be the best I can do since the actual decompilation is super cluttered with a lot of junk/resolving code. The biggest difference between the newer games is the kernel-mode driver, while the majority of anti-cheat code is user-mode and very similar to TAC.
为了解除任何混淆,Black Ops Cold War 并没有 Modern Warfare(2019)及其后续作品所具有的内核模式组件 Ricochet。我将把反作弊系统称为 TAC(Treyarch 反作弊系统),因为我是从 Treyarch 游戏中逆向的。另外,每当提供函数伪代码时,由于实际反汇编非常混乱且包含大量垃圾代码或解决代码,因此只能做到最好。 newer games 之间最大的区别在于内核模式驱动程序,而大多数反作弊代码是用户模式的,并且与 TAC 非常相似。
Let’s look at how the anti-cheat and the game is protected before we dig too deep.
让我们在深入了解之前看看反作弊机制和游戏是如何受到保护的。
Arxan
-
Arxan is an obfuscation/protection tool that’s used on many Call of Duty games, most of which are anything past Black Ops 3. Which includes many features, that make cheaters/reverse engineers’ life a lot harder.
Arxan 是一种混淆/保护工具,被许多《使命召唤》游戏中使用,大多数是黑色行动 3 之后的游戏。它包含许多功能,让作弊者/逆向工程师的生活变得更加困难。Runtime Executable Decryption 运行时可执行文件解密
- The game executable is packed and encrypted; Arxan inserts code during the startup process to unpack and decrypt the game executable.
游戏可执行文件已打包和加密;Arxan 在启动过程中插入代码以解包和解密游戏可执行文件。
Executable Checksums 可执行文件校验和
- Arxan is constantly monitoring the game executable for any patches.
Arxan 不断监控游戏可执行文件以检测任何补丁。 - If you want to learn more about these, momo5502 has a great blog post which can be found here
如果你想了解更多关于这些内容,momo5502 有一篇很棒的博客文章,可以在以下链接找到: - Whenever Arxan detects a debugger or a checksum mismatch, it will terminate the process.
每当 Arxan 检测到调试器或校验和不符时,它将终止进程。
Jmp Obfuscation 跳转混淆
-
Arxan can take a function and all of its instructions and separate them with a jmp.
Arxan 可以取一个函数及其所有指令,并使用 jmp 将它们分开。 -
This is also useful to hide where a function is called from, it breaks IDA and requires an external tool to sift through the instructions.
这也有助于隐藏函数被调用的位置,它会破坏 IDA,并需要外部工具来筛选指令。
push rbp mov rbp, offset unk_7FF60ECD1310 xchg rbp, [rsp] push rbx jmp loc_7FF62B2050A6 loc_7FF62B2050A6: push rax mov rbx, [rsp+10h] mov rax, offset loc_7FF60ECD1622 cmovbe rbx, rax jmp loc_7FF62BD590D3 loc_7FF62BD590D3: mov [rsp+10h], rbx pop rax pop rbx retn loc_7FF60ECD1622: jmp loc_7FF629D04404 ; etc -
This is difficult to analyze statically, especially whenever it’s a giant function that’s been planted with hundreds of jumps.
这个静态分析起来很困难,尤其是当这是一个包含数百个跳转的巨大函数时。
Entrypoint Obfuscation 入口点混淆
- It’s really difficult to follow the entry point on Arxan-protected games; first, you have the protected Arxan code that unpacks and executes the game’s real entry point, which jmp obfuscation can also be planted in here, making it extremely difficult to understand what’s going on.
在受 Arxan 保护的游戏中的入口点很难跟踪;首先,你有受保护的 Arxan 代码,它会解包并执行游戏的实际入口点,这里还可以植入 jmp 混淆,使得理解发生了什么变得极其困难。
Pointer Encryption 指针加密
-
This was actually thought to be Arxan for the longest time, but with recent information, it’s pretty certain this is just something Treyarch has developed and shared with IW for their games, or maybe it’s the other way around.
这 longest time 被认为是 Arxan,但根据最近的信息,这基本上可以确定是 Treyarch 开发并分享给 IW 用于他们的游戏,或者可能是反过来的。 -
Important pointers such as the current game glob, entity array, object pointers, etc., are encrypted and decrypted every time before use.
每次使用前,重要的指针如当前游戏全局、实体数组、对象指针等都会被加密和解密。 -
There are 16 variations of the same encryption method; the current PEB address is actually what decides which encryption method to use.
有 16 种相同的加密方法;当前的 PEB 地址实际上决定了使用哪种加密方法。
-
This is pretty effective and does make your life harder for a little bit.
这确实很有效,会让你的生活暂时变得更复杂一些。
-
Forces you to get the decrypted pointer.
迫使你获取解密后的指针。 -
Prevents cheat engine pointer scanning (when scanning for the memory address of something that is encrypted, the actual global value will be holding the encrypted value, and this value is never set with the decrypted value; the decrypted value is always on the stack.)
防止 Cheat Engine 指针扫描(当扫描加密的某个内存地址时,实际的全局值将持有加密值,而该值从未被设置为解密值;解密值始终在栈上。) -
There are a couple of ways to retrieve these decrypted pointers (these are not all of them):
有几种方法可以获取这些解密指针(这些不是全部方法):
-
Using a tool to trace the decryption instructions.
使用工具追踪解密指令。 -
Creating a hook on spots where the memory has already been decrypted by the game for use.
在游戏已经解密的内存位置创建一个钩子供使用。
__forceinline int get_encryption_method() { // this is actually how it is in the exe // the result of this ROL is 0x60 which is gs[PEB] // these values are generated and will not always be the same const auto value = (unsigned __int8)__ROL1__(-127, 230); auto peb = __readgsqword(value); return _byteswap_uint64(peb << 33) & 0xF; } -
Here’s just a small portion of the operations done in the game exe for the encryption.
这是游戏中 exe 进行加密时执行的操作中的一小部分。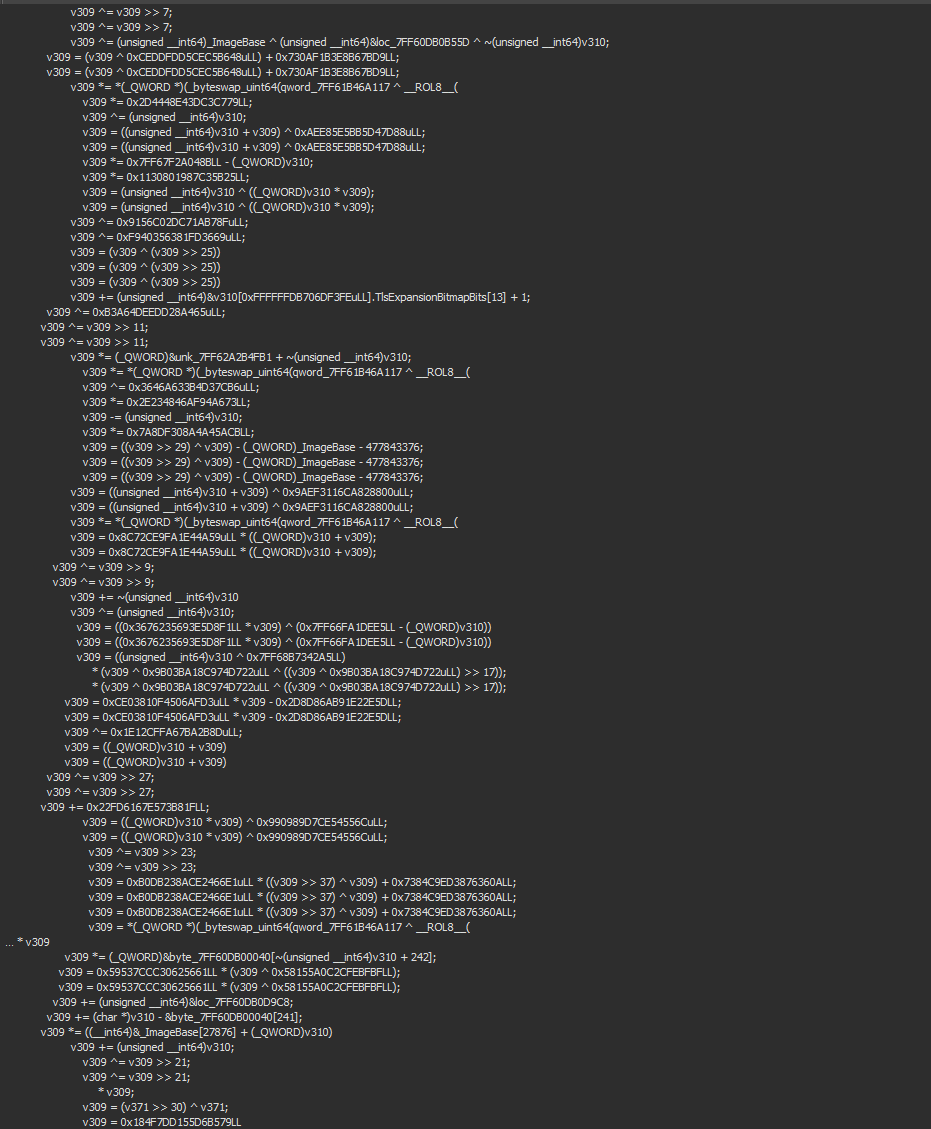
-
-
-
- The game executable is packed and encrypted; Arxan inserts code during the startup process to unpack and decrypt the game executable.
Now we that understand how the game and anti-cheat are protected we can dig deeper. TAC is planted directly into the game executable, uses no kernel components, and will also terminate the process if debug artifacts are found.
现在我们理解了游戏和反作弊是如何受到保护的,就可以深入研究了。TAC 直接植入到游戏可执行文件中,不使用任何内核组件,并且如果发现调试残留信息,还会终止进程。
How does TAC detect monitoring? TAC 如何进行监控检测?
-
API Hook Detection API 拦截检测
-
TAC is designed for Windows; this means it’s going to be using Windows-specific APIs for the anti-cheat.
TAC 是为 Windows 设计的;这意味着它将使用 Windows 特定的 API 进行反作弊。 -
The hook detection used here is pretty basic, and it’s currently only checking for 7 patterns. It looks like they have just taken previous cheats’ hook stubs and put them in.
这里的钩子检测相当基础,目前只检查了 7 种模式。看起来他们只是拿了一些之前作弊程序的钩子 stub 放了进来。 -
NOTE: Each time I provide example code, every API called in that example code is what TAC is using, is being checked for hooks, and is being resolved by their runtime hash lookup. Also, most of TAC is heavily inlined.
注意:每次我提供示例代码时,该示例代码中调用的每个 API 都会被 TAC 检查挂钩,并通过其运行时哈希查找进行解析。此外,TAC 中的大部分内容都被重度内联。; First stub push rax movabs rax,0x0 xchg QWORD PTR [rsp],rax ret ; Second Stub push rbx movabs rbx,0x0 xchg QWORD PTR [rsp],rbx ret ; Third Stub push rcx movabs rcx,0x0 xchg QWORD PTR [rsp],rcx ret ; Fourth Stub push rdx movabs rdx,0x0 xchg QWORD PTR [rsp],rdx ret ; Fifth Stub push 0x0 ret ; Sixth Stub (this is any call, 0xE8, 0x0, 0x0, 0x0, 0x0) call 0x00000 ; Seventh Stub (this is any jmp [rip+x], 0xFF, 0x25, 0x00, 0x00, 0x00, 0x00) jmp QWORD PTR [rip+0]
-
-
Here’s how these checks are implemented. Those 0x0 spots in the assembly are 8 bytes because this is x64.
这些检查是如何实现的。那些汇编中的 0x0 位置是 8 字节,因为这是 x64。
__forceinline void ac_check_hook(unsigned __int64 address, callback cb)
{
  unsigned __int8* current_pos = nullptr;
  bool hook_detected = false;

  for (current_pos = (unsigned __int8 *)address; *current_pos == 144; ++current_pos)
          ;
  switch (*current_pos)
  {
    case 0x50u:
      if (current_pos[1] == 72
          && current_pos[2] == 184
          && current_pos[11] == 72
          && current_pos[12] == 135
          && current_pos[13] == 4
          && current_pos[14] == 36
          && current_pos[15] == 195)
      {
          hook_detected = true;
      }
      break;
    case 0x53u:
      if (current_pos[1] == 72
          && current_pos[2] == 187
          && current_pos[11] == 72
          && current_pos[12] == 135
          && current_pos[13] == 28
          && current_pos[14] == 36
          && current_pos[15] == 195)
      {
          hook_detected = true;
      }
      break;
    case 0x51u:
      if (current_pos[1] == 72
          && current_pos[2] == 185
          && current_pos[11] == 72
          && current_pos[12] == 135
          && current_pos[13] == 12
          && current_pos[14] == 36
          && current_pos[15] == 195)
      {
          hook_detected = true;
      }
      break;
    case 0x52u:
      if (current_pos[1] == 72
          && current_pos[2] == 186
          && current_pos[11] == 72
          && current_pos[12] == 135
          && current_pos[13] == 20
          && current_pos[14] == 36
          && current_pos[15] == 195)
      {
          hook_detected = true;
      }
      break;
    case 0x68u:
      if (current_pos[5] == 195)
          hook_detected = true;
      break;
    case 0xE9u:
      hook_detected = true;
      break;
    default:
      if (*current_pos == 255 && current_pos[1] == 37)
          hook_detected = true;
      break;
  }
  if (hook_detected)
  {
      cb();
  }
}

// example usage
ac_check_hook((unsigned __int64)&Thread32First, callback);
Runtime API Export Lookup 运行时 API 导出查找
- TAC has an inlined API lookup function; it takes the module hash and the API name hash, iterates the current list of loaded modules, hashes the name, then goes through each exported function from that module and compares it to the compile-time hash of the API they want.
TAC 包含一个内联的 API 查找函数;它接受模块哈希和 API 名称哈希,遍历当前加载的模块列表,对名称进行哈希处理,然后遍历该模块中导出的每个函数,并将其与他们想要的 API 的编译时哈希进行比较。
This is what the decomp looks like.
这是反汇编后的样子。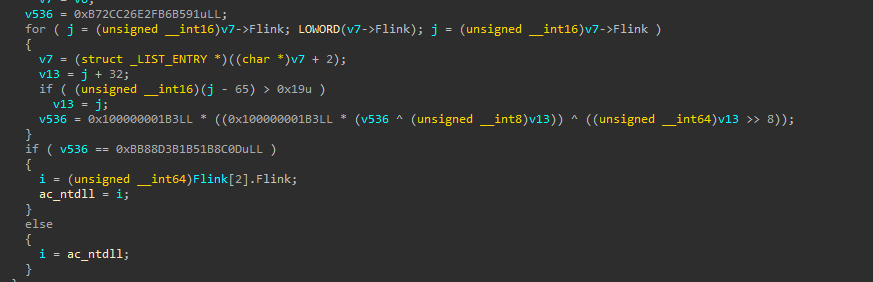
Here’s a recreation of their runtime lookup.
这是他们运行时查找的重现。
  void* get_module_base(size_t base, size_t hash)
  {
  	ac_setbase(base);

  	auto peb = static_cast<PPEB>(NtCurrentPeb());
  	auto head = &peb->Ldr->InMemoryOrderModuleList;

  	int mc = 0;
  	auto entry = head->Flink;
  	while (entry != head)
  	{
  		auto table_entry = CONTAINING_RECORD(entry, LDR_DATA_TABLE_ENTRY, InMemoryOrderLinks);
  		auto n = static_cast<int>(offsetof(LDR_DATA_TABLE_ENTRY, DllBase));

  		char buf[255];
  		size_t count = 0;
  		wcstombs_s(&count, buf, table_entry->FullDllName.Buffer, table_entry->FullDllName.Length);

        // this is just from my hash tool; +20 skips past C:\Windows\System32
  		auto h = ac_mod64(buf + 20);
  		if (h == hash)
  		{
            return table_entry->DllBase;
  			break;
  		}

  		entry = entry->Flink;
  	}

    return nullptr;
  }
How can we figure out what these hashes are? 我们怎么找出这些哈希是什么?
The answer is super simple; I grabbed a list of all the loaded modules in my game process and copied over the game’s hashing function (note: dll names are hashed a little bit differently), which can be seen here.
答案非常简单;我在游戏进程中抓取了所有加载模块的列表,并复制了游戏的哈希函数(注意:dll 名称的哈希方式略有不同),具体内容可见这里。
// this is used for dll names
size_t ac_mod64(const char* str)
{
	auto base = ac_getbase();
	while (*str)
	{
		auto v203 = *str++;
		auto v39 = v203;

		if (v203 >= 0x41u && v39 <= 0x5Au)
			v39 += 32;
		base = 0x100000001B3i64 * (((v39 & 0xFF00) >> 8) ^ (0x100000001B3i64 * (static_cast<unsigned __int8>(v39) ^
			base)));
	}
	return base;
}

// this is used for exported function names
size_t ac_fnv64(const char* str)
{
    auto base = ac_getbase();
    while (*str)
    {
        auto s = *str++;
        auto v12 = s;
        if (s >= 65 && v12 <= 90)
            v12 += 32;

        base = ac_prime * (v12 ^ base);
    }
    return base;
}
I took that function and calculated the hash of all the module names and exports from the module list that I grabbed, then created a function to look up these API names by using the FNV hash base and the inlined hash of the API name.
我将那个函数计算了所有模块名称和模块列表中导出内容的哈希值,然后创建了一个函数,通过使用 FNV 哈希基础和内联的 API 名称哈希来查找这些 API 名称。
Here’s how I managed to cache and resolve all of the exports.
我是如何缓存和解析所有导出内容的。
void cache_exports()
{
    for (auto dll : loadedDlls)
    {
        HMODULE mod = GetModuleHandleA(dll.c_str());
        if (!mod)
        {
            continue;
        }

        IMAGE_DOS_HEADER* mz = (PIMAGE_DOS_HEADER)mod;
        IMAGE_NT_HEADERS* nt = RVA2PTR(PIMAGE_NT_HEADERS, mz, mz->e_lfanew);

        IMAGE_DATA_DIRECTORY* edirp = &nt->OptionalHeader.DataDirectory[IMAGE_DIRECTORY_ENTRY_EXPORT];
        IMAGE_DATA_DIRECTORY edir = *edirp;

        IMAGE_EXPORT_DIRECTORY* exports = RVA2PTR(PIMAGE_EXPORT_DIRECTORY, mz, edir.VirtualAddress);

        DWORD* addrs = RVA2PTR(DWORD*, mz, exports->AddressOfFunctions);
        DWORD* names = RVA2PTR(DWORD*, mz, exports->AddressOfNames);
        for (unsigned i = 0; i < exports->NumberOfFunctions; i++)
        {
            char* name = RVA2PTR(char*, mz, names[i]);
            void* addr = RVA2PTR(void*, mz, addrs[i]);

            MEMORY_BASIC_INFORMATION mbi;
            if (ssno::bypass::VirtualQuery((void*)name, &mbi, sizeof(mbi)))
            {
                if (mbi.AllocationBase == mod)
                {
                    hashes[ac_fnv64(name)] = std::string(name);
                }
            }
        }

    }
}

void lookup_hash(size_t base, size_t hash)
{
	ac_setbase(base);

	hashes.clear();
	cache_exports();

	if (hashes.find(hash) == hashes.end())
	{
		printf("Failed to find hash: 0x%p\n", hash);
		return;
	}

	printf("0x%p, 0x%p = %s\n", base, hash, hashes[hash].c_str());
}
-
After all of this, it was time to do some manual work.
经过这一切之后,是时候做一些手工工作了。
- I went in by hand and grabbed the base hashes and function hashes from the decompilation then put those into my program.
我手动进去,从反汇编中抓取了基础哈希和函数哈希,然后将这些内容输入到我的程序中。 - Now I was able to tell exactly which APIs the anti-cheat was calling.
现在我可以确切地知道反作弊系统调用了哪些 API。
- I went in by hand and grabbed the base hashes and function hashes from the decompilation then put those into my program.
Here’s how my tool ended up working.
我的工具最终是这样工作的。
// (lookup_pebhash is the get_module_base function I wrote about further up)
lookup_pebhash(0xB8BC6A966753F382u, 0x7380E62B9E1CA6D6); // ntdll
lookup_hash(0x6B9D7FEE4A7D71CEui64, 0xE5FAB4B4E649C7A4ui64); // VirtualProtect
lookup_hash(0x1592DD0A71569429i64, 0xB5902EE75629AA6Cui64); //NtAllocateVirtualMemory
lookup_hash(0x3E4D681B236AE0A0i64, 0x3AB0D0D1450DE52Di64); //GetWindowLongA
lookup_hash(0x77EF6ADABFA1098Fi64, 0x94CA321842195A88ui64); //OpenProcess
lookup_hash(0xA3439F4AFAAB52AEui64, 0xE48550DEAB23A8C9ui64); //K32EnumProcessModules
lookup_hash(0x2004CA9BE823B79Ai64, 0x828CC84F9E74E1A0ui64); //CloseHandle
lookup_hash(0x423E363D6FEF8CEAi64, 0x5B3E9BDB215405F3i64); //K32GetModuleFileNameExW
lookup_hash(0x52D5BB326B1FC6B2i64, 0x1C2D0172D09B7286i64); //GetWindowThreadProcessId
lookup_hash(0x13FA4A203570A0A2i64, 0xB8DA7EDECE20A5DCui64); //GetWindowDisplayAffinity
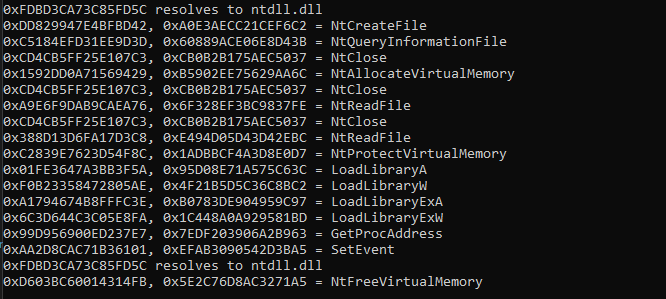
I do want to mention that these hashes aren’t going to be the same in different versions of the game. Also, this isn’t the only way of beating this hashing technique; these function pointers are stored in global variables; you can simply inspect them and match the virtual address of the function to one of the exported functions from all of the DLLs loaded.
这些哈希在游戏的不同版本中不会相同。此外,这也不是破解这种哈希技术的唯一方法;这些函数指针存储在全局变量中;你可以简单地检查它们,并将函数的虚拟地址与所有加载的 DLL 中导出的函数之一匹配。
Ok, now we have established that TAC detects API hooking (It only checks functions that it uses, not actually checking all important APIs for hooks, just the ones it’s using). These are only here to monitor API hooking attempts that would hurt or prevent the anti-cheat from doing its job.
好的,现在我们已经确定 TAC 可以检测 API 挂钩(它只检查自己使用的功能,而不是实际检查所有重要的 API 挂钩,只是检查它使用的那些)。这些功能只是为了监控可能损害或阻止反作弊软件执行其功能的 API 挂钩尝试。
What if there was a hooking method that bypassed their hooking detections?
如果有一种钩子方法可以绕过他们的钩子检测呢?
Debug Registers 调试寄存器
For actual cheaters trying to hook into the game, Arxan has got the code patching covered; cheaters must use non-code patching hooking methods while Arxan is present. There are a couple of these hooking methods, and I’ll list a few here:
对于试图勾接入游戏的实际作弊者,Arxan 已经涵盖了代码修补的问题;在 Arxan 存在的情况下,作弊者必须使用非代码修补的勾接方法。这些勾接方法有几种,我这里列举几种:
-
Exception hooking - Forcefully triggering an exception and handling it.
异常挂钩 - 强制触发异常并处理它。
- Exceptions can be triggered in multiple ways.
异常可以由多种方式触发。 - Modify a global pointer to be a nullptr or invalid memory address.
将全局指针修改为 nullptr 或无效内存地址。 - Modify page access protections to trigger an access exception (Example: PAGE_NOACCESS or PAGE_GUARD).
修改页面访问保护以触发访问异常(示例:PAGE_NOACCESS 或 PAGE_GUARD)。
- Exceptions can be triggered in multiple ways.
-
Debug registers - telling the CPU to break (throw a STATUS_SINGLE_STEP exception) on a specific instruction.
调试寄存器 - 告知 CPU 在执行特定指令时中断(抛出 STATUS_SINGLE_STEP 异常)。
-
These are very powerful; the CPU can break on any or all of these conditions for a given instruction address.
这些非常强大;对于给定的指令地址,CPU 可能在这些条件中的任何一个或所有条件下失效。
- Read 阅读
- Write 写
- Execute 执行
-
Debug registers are the easiest to use, the most popular, and the easiest to detect!
调试寄存器最容易使用,最受欢迎,也最容易检测!
-
Since debug registers are so popular and powerful, and completely bypass Arxan’s .text patch monitoring, this makes them the perfect hooking technique for Call of Duty games.
由于调试寄存器非常流行且功能强大,并且完全绕过了 Arxan 的 .text 代码监控,这使得它们成为 Call of Duty 游戏的理想挂钩技术。
Here’s how TAC checks for debug registers. TAC 是如何检查调试寄存器的。
    __forceinline void ac_check_debug_registers(HANDLE thread_handle, fn callback)
    {
        CONTEXT context;
        context.ContextFlags = CONTEXT_FULL;

        if (!GetThreadContext(thread_handle, &context))
        {
            return;
        }

        if (context.Dr0 || context.Dr1 || context.Dr2 || context.Dr3)
        {
          if (GetProcessIdOfThread(thread_handle) != GetCurrentProcessId())
          {
            callback("debug registers found, but not in our process");
          }
          else
          {
            callback("debug registers found inside current process");
          }

          // the anti-cheat would then jump to the quit functions that I wrote about a little bit further down
          // default will call ac_terminate_process_clear_registers
          // if ZwTerminateProcess was hooked it will jump to ac_close_game2_crash_zeroxzero
        }
    }

    // access rights that are requested
    __forceinline HANDLE ac_open_thread(int pid)
    {
      return OpenThread(THREAD_QUERY_INFORMATION | THREAD_GET_CONTEXT, 0, pid);
    }
- Since debug registers are in the DR0-DR3 registers, you can’t just write some custom assembly to directly read them because these registers are privileged and must be fetched by the Windows kernel or sent to the process by Windows whenever an exception occurs.
由于调试寄存器位于 DR0-DR3 寄存器中,你不能直接通过自定义汇编代码来读取它们,因为这些寄存器是受保护的,必须由 Windows 内核在发生异常时获取或发送给进程。
; This will throw a STATUS_PRIVILEGED_INSTRUCTION exception
mov rax, dr0
ret
Driver Signing Enforcement 驱动程序签名强制执行
- Windows has a test mode, which is designed for driver development.
Windows 有一个测试模式,该模式用于驱动程序开发。 - This will allow you to bypass the normal Windows restriction on kernel-mode drivers not having valid digital signatures.
这将允许你绕过正常 Windows 对内核模式驱动程序必须具有有效数字签名的限制。 - This is a protection mechanism in place to prevent bad actors from running kernel mode drivers on your system without the proper authorization.
这是一项保护机制,用于防止未授权的人员在您的系统上运行内核模式驱动程序。 - TAC will know if you have test mode enabled on Windows, via *ntdll!NtQuerySystemInformation*. This isn’t going to ban you directly, but this will have your account flagged.
TAC 会通过 ntdll!NtQuerySystemInformation 知道你在 Windows 中启用了测试模式。这不会直接封禁你,但会标记你的账户。
__forceinline bool is_test_signing_on()
{
	SYSTEM_CODEINTEGRITY_INFORMATION sys_cii;
	sys_cii.Length = sizeof(sys_cii);
	NTSTATUS status = NtQuerySystemInformation(103, &sys_cii, static_cast<ULONG>(sizeof(sys_cii)), static_cast<PULONG>(NULL));
	if (NT_SUCCESS(status))
	{
		return !!(sys_cii.CodeIntegrityOptions & /*CODEINTEGRITY_OPTION_TESTSIGN*/ 0x2);
	}
	return false;
}

__forceinline void ac_check_test_signing(callback cb)
{
  if (is_test_signing_on())
  {
    cb();
  }
}
Now we understand some of TAC’s anti-static analysis and debug register detection tactics. We’re going to move on to the more advanced detections implemented into TAC.
现在我们了解了部分 TAC 的抗静电分析和调试寄存器检测策略。接下来我们将转向 TAC 中实现的更高级检测。
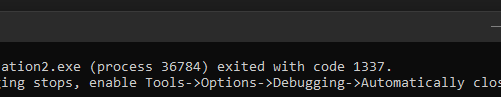
How does TAC exit the process? TAC 是如何退出该过程的?
-
TAC uses two ways of exiting the process; both of them clear the registers, and these are written in inline shellcode.
TAC 使用两种退出过程的方式;这两种方式都会清空寄存器,这些内容是以内联 shellcode 编写的。
-
The first method sets RCX to -1 as it calls NtTerminateProcess.
该方法将 RCX 设置为 -1,因为它调用了 NtTerminateProcess。 -
TAC will not use this method if NtTerminateProcess is detected to be hooked.
TAC 如果检测到 NtTerminateProcess 被挂钩将不会使用这种方法。 -
If NtTerminateProcess is hooked, it’ll go to the second one, which jumps to 0x0.
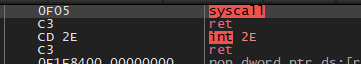
如果 NtTerminateProcess 被挂钩,它会跳到第二个,然后跳转到 0x0。xor rax, rax xor rbx, rbx xor rcx, rcx dec rcx xor rdx, rdx xor rsi, rsi xor rdi, rdi xor r8, r8 xor r9, r9 xor r10, r10 xor r11, r11 xor r12, r12 xor r13, r13 xor r14, r14 xor r15, r15 mov rsp, 0x0F8 jmp qword ptr [0x1B607DC7FF0] ; This is not a custom syscall setup; this is a jump to ntdll!NtTerminateProcess. spot_1B607DC7FF0: mov r10, rcx mov eax, 0x2C test byte ptr [0x7FFE0308], 1 jne NtTerminateProcess + 0x15 (0x07FFA7A3CDA75) syscall retHere’s the second method; we can see the same register clearing, and we see a jmp. This jump goes to 0x0, which will crash the process.
这里是第二种方法;我们可以看到相同的寄存器清零,然后看到一个 jmp。这个跳转指向 0x0,将会导致进程崩溃。xor rax, rax xor rbx, rbx xor rcx, rcx xor rdx, rdx xor rsi, rsi xor rdi, rdi xor r8, r8 xor r9, r9 xor r10, r10 xor r11, r11 xor r12, r12 xor r13, r13 xor r14, r14 xor r15, r15 xor rsp, rsp xor rbp, rbp jmp qword ptr [0x27E45550036] ; value of 0x27E45550036 = 0x000000000000These are hard to recover from since all of the important registers are cleared.
这些很难恢复,因为所有的关键寄存器都被清空了。
The code for generating and running these shellcodes is provided here.
这些 shellcodes 的生成和运行代码在此提供。// these are reconstructed to make it readable void ac_terminate_process_clear_registers() { const auto memory = reinterpret_cast<unsigned __int64>(VirtualAlloc( nullptr, 0x8000uLL, MEM_COMMIT | MEM_RESERVE, PAGE_EXECUTE_READWRITE )); const auto proc_addr = reinterpret_cast<unsigned __int64>(GetProcAddress( LoadLibraryA("ntdll.dll"), "ZwTerminateProcess" )); unsigned char terminate_process_shellcode[] = { 0x48, 0x31, 0xC0, // xor rax, rax 0x48, 0x31, 0xDB, // xor rbx, rbx 0x48, 0x31, 0xC9, // xor rcx, rcx 0x48, 0xFF, 0xC9, // dec rcx 0x48, 0x31, 0xD2, // xor rdx, rdx 0x48, 0x31, 0xF6, // xor rsi, rsi 0x48, 0x31, 0xFF, // xor rdi, rdi 0x4D, 0x31, 0xC0, // xor r8, r8 0x4D, 0x31, 0xC9, // xor r9, r9 0x4D, 0x31, 0xD2, // xor r10, r10 0x4D, 0x31, 0xDB, // xor r11, r11 0x4D, 0x31, 0xE4, // xor r12, r12 0x4D, 0x31, 0xED, // xor r13, r13 0x4D, 0x31, 0xF6, // xor r14, r14 0x4D, 0x31, 0xFF, // xor r15, r15 0x48, 0xC7, 0xC4, 0xF8, 0x00, 0x00, 0x00, // mov rsp, 0x0F8 0xFF, 0x25, 0x00, 0x00, 0x00, 0x00 // jmp QWORD PTR [rip + 0x0] }; const auto zw_terminate_process_spot = 0x320; // write the address of ZwTerminateProcess somewhere *reinterpret_cast<__int64*>(memory + zw_terminate_process_spot) = proc_addr; // calculate the memory offset of where ZwTerminateProcess was written (needs to be RVA from RIP) const auto rva_addy = zw_terminate_process_spot - sizeof(terminate_process_shellcode); *reinterpret_cast<DWORD*>(&terminate_process_shellcode[sizeof (terminate_process_shellcode) - 4]) = rva_addy; memcpy(reinterpret_cast<void*>(memory), terminate_process_shellcode, sizeof (terminate_process_shellcode)); reinterpret_cast<void(*)()>(memory)(); }void ac_close_game2_crash_zeroxzero() { const auto memory = reinterpret_cast<__int64>(VirtualAlloc( nullptr, 0x40uLL, MEM_COMMIT | MEM_RESERVE, PAGE_EXECUTE_READWRITE )); memset(reinterpret_cast<void*>(memory), 0, 0x40); unsigned char zero_zero_shellcode[] = { 0x48, 0x31, 0xC0, // xor rax, rax 0x48, 0x31, 0xDB, // xor rbx, rbx 0x48, 0x31, 0xC9, // xor rcx, rcx 0x48, 0x31, 0xD2, // xor rdx, rdx 0x48, 0x31, 0xF6, // xor rsi, rsi 0x48, 0x31, 0xFF, // xor rdi, rdi 0x4D, 0x31, 0xC0, // xor r8, r8 0x4D, 0x31, 0xC9, // xor r9, r9 0x4D, 0x31, 0xD2, // xor r10, r10 0x4D, 0x31, 0xDB, // xor r11, r11 0x4D, 0x31, 0xE4, // xor r12, r12 0x4D, 0x31, 0xED, // xor r13, r13 0x4D, 0x31, 0xF6, // xor r14, r14 0x4D, 0x31, 0xFF, // xor r15, r15 0x48, 0x31, 0xE4, // xor rsp, rsp 0x48, 0x31, 0xED, // xor rbp, rbp 0xFF, 0x25, 0x00, 0x00, 0x00, 0x00 // jmp qword ptr[rip + 0] }; // this offset will just be to memory thats already 0x00000000 *reinterpret_cast<DWORD*>(&zero_zero_shellcode[sizeof(zero_zero_shellcode) - 4]) = 4; memcpy(reinterpret_cast<void*>(memory), zero_zero_shellcode, sizeof (zero_zero_shellcode)); reinterpret_cast<void(*)()>(memory)(); }
-
Detecting Cheat Logging 检测作弊记录
-
Oftentimes, internal cheaters will allocate a console using
AllocConsole
to print their debug logs to, or even make their menu in it using print statements.
oftentimes, 内部作弊者会使用 AllocConsole 分配一个控制台来打印他们的调试日志,甚至会在其中使用 print 语句制作他们的菜单。
-
The PEB (Process Environment Block) contains information regarding the allocation of a console.
PEB (进程环境块) 包含有关控制台分配的信息。
- The PEB contains a ton of useful information regarding the process. If you want to read more about this click here; most of this structure is undocumented, but that’ll take you to the MSDN page.
PEB 包含了许多有关进程的有用信息。如果你想了解更多内容,请点击这里;大部分结构尚未文档化,但这会将你导向 MSDN 页面。
- The PEB contains a ton of useful information regarding the process. If you want to read more about this click here; most of this structure is undocumented, but that’ll take you to the MSDN page.
-
The game knows that there shouldn’t ever be a console window allocated; checking for one is super simple and will catch some people who use this method of logging. Here’s the implementation.
游戏知道不应该分配控制台窗口;检查是否存在这样的窗口非常简单,并且可以捕捉到使用这种方法进行日志记录的一些人。以下是实现方法。
__forceinline void ac_detect_allocated_console(fn callback)
{
  if (GetConsoleWindow() != 0 || NtCurrentPeb() ->ProcessParameters->ConsoleHandle != 0)
  {
    callback();
  }
}
-
Detecting Visuals 检测视觉内容
-
Cheaters need to draw on the screen if they want a working ESP or even a Menu/User Interface.
作弊者如果想要使用 ESP 或甚至菜单/用户界面,就需要在屏幕上绘制。-
How do they do this?
他们是怎么做到的?
- There are a few ways of drawing on the screen; the most common method for internal cheats is to hook whichever graphics API the game is using and draw their information in there.
在屏幕上绘制的方法有几种;对于内部作弊来说,最常见的方法是钩住游戏使用的 whichever 图形 API,并在那里绘制他们的信息。 - Modern Call of Duty games are made with DirectX 12.
现代的《使命召唤》游戏使用 DirectX 12 开发。 - A common function to hook when wanting to draw things on DirectX is IDXGISwapChain::Present.
当想要在 DirectX 上绘制东西时,一个常见的挂钩函数是 IDXGISwapChain::Present。 - The present function is what presents the rendered game image to the user. The idea is you add your custom data to the image before it’s presented to the user, update the image then present it to the user.
当前的功能是将渲染好的游戏图像呈现给用户。想法是在呈现给用户之前向图像添加自定义数据,更新图像然后将其呈现给用户。
- There are a few ways of drawing on the screen; the most common method for internal cheats is to hook whichever graphics API the game is using and draw their information in there.
-
How is this detected?
这是如何检测到的?
-
First, we need to understand how these functions are hooked.
首先,我们需要了解这些函数是如何被挂钩的。
- The DirectX functions are inside of the dxgi DLL on your computer.
DirectX 函数位于您计算机上的 dxgi 动态链接库中。 - DirectX interfaces hold vtables which will point to the functions inside of dxgi, these vtable indexes will be the same across the versions of windows.
DirectX 接口包含 vtables,这些 vtables 将指向 dxgi 内的函数,这些 vtable 的索引在不同版本的 Windows 中是相同的。 - IDXGISwapChain vtable holds the present function.
IDXGISwapChain vtable 持有 present 函数。 - This can either be directly hooked, or pointer swapped.
这可以直接挂钩,或者指针交换。
- The DirectX functions are inside of the dxgi DLL on your computer.
-
Detecting these hooks.
检测这些钩子。
-
Something that can be done is to scan the DXGI present function, but TAC doesn’t currently do this.
可以做的是一扫描 DXGI present 函数,但 TAC 目前并不执行这一操作。 -
TAC checks the present pointer in the vtable.
TAC 检查 vtable 中的当前指针。 -
DirectX 12
introduced command queues; whenever the game is drawing something, it’s from the command queue, a list of draw commands. This is something cheaters will also need if they want to draw.
DirectX 12 引入了命令队列;每当游戏绘制某些内容时,都是从命令队列中获取,这是一个包含绘制命令的列表。如果作弊者也想绘制内容,他们也需要用到这一点。
-
How do cheaters get this command queue?
作弊者是如何获取这个命令队列的?
- The most common method of grabbing the game’s command queue is to hook another function from the command queue interface, ID3D12CommandQueue::ExecuteCommandLists.
抓取游戏命令队列的最常见方法是钩住命令队列接口中的另一个函数,即 ID3D12CommandQueue::ExecuteCommandLists。 - Since this is an interface, the methods will have a *this* pointer passed as the first parameter; in this case, that pointer is the command queue.
由于这是一个接口,方法的第一个参数将传递一个 this 指针;在这种情况下,该指针是命令队列。
- The most common method of grabbing the game’s command queue is to hook another function from the command queue interface, ID3D12CommandQueue::ExecuteCommandLists.
-
-
-
-
Cool information:
酷的信息:
- Many things such as OBS Studio/Streamlabs OBS/Discords game overlay/Steams game overlay actually all do this, while Steam and Discord draw here, things like OBS studio are just here to capture the rendered image (capture the frames) and save them into your recording. This only happens if you use game capture on recording software.
许多软件如 OBS Studio/Streamlabs OBS/Discords 游戏覆盖/Steam 游戏覆盖实际上都做到了这一点,而 Steam 和 Discord 则在此绘制内容,像 OBS Studio 这样的软件只是用来捕获渲染的图像(抓取帧)并将其保存到你的录制中。这只有在你使用游戏捕获功能进行录制时才会发生。 - Cheaters can ignore the game, and simply hook into Discord/steam and draw things there if they want to.
作弊者可以忽略这款游戏,只需连接到 Discord/steam 并在那里绘制东西即可。
- Many things such as OBS Studio/Streamlabs OBS/Discords game overlay/Steams game overlay actually all do this, while Steam and Discord draw here, things like OBS studio are just here to capture the rendered image (capture the frames) and save them into your recording. This only happens if you use game capture on recording software.
-
What about External Cheats? 关于外部作弊怎么办?
-
External cheats are most likely going to create an overlapped window that covers the width and height of the game window. There are a few ways to detect this; the detection methods heavily rely on Windows APIs and require more effort to implement.
外部作弊程序很可能创建一个覆盖游戏窗口宽度和高度的重叠窗口。检测这种方法有几种方式;检测方法主要依赖于 Windows API,实现起来需要更多的努力。 -
TAC loops through all of the windows, checking their window style for WS_EX_LAYERED using GetWindowLongA; once it finds that, it then compares that window’s rect with the game rect using GetWindowRect.
TAC 会遍历所有窗口,使用 GetWindowLongA 检查其窗口样式是否包含 WS_EX_LAYERED;找到后,再使用 GetWindowRect 将该窗口的矩形与游戏矩形进行比较。 -
After all of that, if the window is over the game’s rect and it is a layered window, the hwnd to that window will be cached, which will later be used for many string checks. This stores a bunch of information and uploads it to their servers.
在那之后,如果窗口在游戏的 rect 之上且是分层窗口,该窗口的 hwnd 将会被缓存,稍后将用于许多字符串检查。这会存储大量信息并上传到他们的服务器。Here we can see how that works.
在这里,我们可以看到它是如何工作的。GetWindowRect(hwnd, &output_rect); if (output_rect.right >= game_rect_7FF61BBA2F50.left && output_rect.left <= game_rect_7FF61BBA2F50.right && output_rect.bottom >= game_rect_7FF61BBA2F50.top && output_rect.top <= game_rect_7FF61BBA2F50.bottom) { min_value = get_min_value(output_rect.left, game_rect_7FF61BBA2F50.left); greater_value = get_greater_value(output_rect.right, game_rect_7FF61BBA2F50.right); v193 = get_min_value(output_rect.top, game_rect_7FF61BBA2F50.top); v195 = get_greater_value(output_rect.bottom, game_rect_7FF61BBA2F50.bottom); v76 = (float)((v193 - v195) * (greater_value - min_value)) / (float)((game_rect_7FF61BBA2F50.top - game_rect_7FF61BBA2F50.bottom) * (game_rect_7FF61BBA2F50.right - game_rect_7FF61BBA2F50.left)); if (v76 >= 0.5 && cached_window_count < 8) cached_windows[cached_window_count++] = hwnd; }RECT game_rect_7FF61BBA2F50; game_rect_7FF61BBA2F50 RECT <0, 0, 780h, 438h>;-
We can see 0x780 and 0x438, which represent 1920 by 1080, which was my screen size. Okay, so we know the windows are cached. Now what?
我们可以看到 0x780 和 0x438,这代表 1920x1080,这是我屏幕的尺寸。好的,所以我们知道窗口是缓存的。现在怎么办? -
The cached list is handled in another function that checks the window text and its class names.
缓存的列表由另一个函数处理,该函数检查窗口文本及其类名。 -
TAC queries the window text using GetWindowTextW.
TAC 使用 GetWindowTextW 查询窗口文本。 -
TAC queries the window class name using GetClassNameA.
TAC 使用 GetClassNameA 查询窗口类名。 -
Cheat developers can hide their overlapping windows from recording software, and screenshot tools using SetWindowDisplayAffinity with WDA_EXCLUDEFROMCAPTURE.
作弊开发者可以使用 SetWindowDisplayAffinity 与 WDA_EXCLUDEFROMCAPTURE 来隐藏他们的重叠窗口,从而避开录屏软件和截屏工具。-
This is checked by TAC, and it’s saved into the buffer that will be uploaded to their servers later.
这会由 TAC 检查,并保存到稍后上传到他们服务器的缓冲区中。
ac_fmt_sprint(v1035, 32LL, "%lu", display_affinity); -
There are a couple more things related to the window that are uploaded as well.
还有一些与窗口相关的额外内容也被上传了。
- The normal window style is also checked; you can find more here.
正常的窗口样式也会被检查;更多内容请参见此处。 - TAC checks that the window is visible first before any more processing happens on it.
TAC 在对窗口进行任何进一步处理之前,会首先检查窗口是否可见。
- The normal window style is also checked; you can find more here.
-
-
TAC also stores the list of modules, including the exe name of the overlapping window.
TAC 还存储模块列表,包括重叠窗口的 exe 名称。-
When you do anything in Windows to another process, you need to have permission; Windows has an API that will let you request permission from the system.
OpenProcess
当你在 Windows 中对另一个进程进行任何操作时,你需要有权限;Windows 有一个 API 可以让你从系统请求权限。OpenProcess
HANDLE process_handle = OpenProcess(0x410, 0LL, pid);
-
-
The first parameter in OpenProcess is the access desired, since this is a bitmask our reversing software will just show us 0x410 by default, but that doesn’t do us any good!
OpenProcess 的第一个参数是访问权限,由于这是一个位掩码,因此逆向工程软件默认只会显示 0x410,但这对我们没有帮助!-
This can be figured out with some IDA magic.
这可以通过一些 IDA 技巧来解决。 -
Creating a
bitmask structure
in IDA Pro and setting that as the function declaration’s first parameter helps us out.
在 IDA Pro 中创建位掩码结构并将该结构作为函数声明的第一个参数有助于我们解决问题。
// these are taken from https://learn.microsoft.com/en-us/windows/win32/procthread/process-security-and-access-rights enum __bitmask process_access_flags { PROCESS_TERMINATE = 0x1, PROCESS_CREATE_THREAD = 0x2, PROCESS_SET_SESSIONID = 0x4, PROCESS_VM_OPERATION = 0x8, PROCESS_VM_READ = 0x10, PROCESS_VM_WRITE = 0x20, PROCESS_DUP_HANDLE = 0x40, PROCESS_CREATE_PROCESS = 0x80, PROCESS_SET_QUOTA = 0x100, PROCESS_SET_INFORMATION = 0x200, PROCESS_QUERY_INFORMATION = 0x400, PROCESS_SUSPEND_RESUME = 0x800, PROCESS_QUERY_LIMITED_INFORMATION = 0x1000, PROCESS_SET_LIMITED_INFORMATION = 0x2000, }; -
Here’s the resulting code we get from IDA.
这是从 IDA 获取的 resulting code。
HANDLE handle = OpenProcess(PROCESS_VM_READ | PROCESS_QUERY_INFORMATION, 0LL, pid);-
As you can see, TAC wants to read the overlapping process’ virtual memory, and it wants to query information about the process.
如您所见,TAC 希望读取重叠过程的虚拟内存,并希望查询该过程的信息。 -
This is the access level you would expect for enumerating process modules. example.
这是列举进程模块时你所期望的访问级别。 example. -
The first thing TAC does with this handle is call K32EnumProcessModules.
TAC 首先使用此句柄调用 K32EnumProcessModules。 -
After that, TAC loops through the process modules and gathers the name of each using K32GetModuleFileNameExW.
在那之后,TAC 会遍历过程模块,并使用 K32GetModuleFileNameExW 获取每个模块的名称。 -
Then the strings are encrypted and stored into the encryption buffer.
然后对字符串进行加密并存储到加密缓冲区中。
-
-
Here’s what the majority of the code looks like.
以下是代码的大致样子。
void ac_cached_window(HWND hwnd) { if (hwnd == game_hwnd) { return; } const auto is_visible = (GetWindowLongA(hwnd, GWL_STYLE) & WS_VISIBLE) != 0; if (!is_visible) { return; } const auto window_style = GetWindowLongA(hwnd, GWL_EXSTYLE); const auto is_top_most = (window_style & WS_EX_TOPMOST) != 0; const auto is_layered_window = (window_style & WS_EX_LAYERED) != 0; if (!is_top_most && !is_layered_window) { return; } RECT output_rect; GetWindowRect(hwnd, &output_rect); if (output_rect.right >= game_rect.left && output_rect.left <= game_rect.right && output_rect.bottom >= game_rect.top && output_rect.top <= game_rect.bottom) { const auto min_value_x1 = min(output_rect.left, game_rect.left); const auto max_value_x2 = max(output_rect.right, game_rect.right); const auto min_value_y1 = min(output_rect.top, game_rect.top); const auto max_value_y2 = max(output_rect.bottom, game_rect.bottom); const auto difference_center = static_cast<float>((min_value_y1 - max_value_y2) * (max_value_x2 - min_value_x1)) / static_cast<float>((game_rect.top - game_rect.bottom) * (game_rect.right - game_rect.left)); if (difference_center >= 0.5 && cached_window_count < 8) { cached_windows[cached_window_count++] = hwnd; } } } void ac_log_cached_window_process(unsigned int pid, char* encrypted_string_buffer) { const HANDLE process_handle = OpenProcess(PROCESS_VM_READ | PROCESS_QUERY_INFORMATION, 0LL, pid); if (process_handle == INVALID_HANDLE_VALUE) { return; } DWORD lpcbNeeded = 0; HMODULE modules[1024]; if (K32EnumProcessModules(process_handle, modules, 0x2000LL, &lpcbNeeded)) { for (auto current_module_index = 0; ; ++current_module_index) { if (current_module_index >= lpcbNeeded / 8uLL) break; const auto current_module = modules[current_module_index]; WCHAR wide_module_name[260]; if (K32GetModuleFileNameExW(process_handle, current_module, wide_module_name, 260LL)) { char ascii_module_name[1568]; WideCharToMultiByte(65001LL, 0LL, wide_module_name, 0xFFFFFFFFLL, ascii_module_name, 1560, 0LL, 0LL); ac_string_encrypt(encrypted_string_buffer, ascii_module_name); } } } CloseHandle(process_handle); } void ac_handle_window(HWND hwnd, char* encrypted_string_thing) { // tons of string encryption stuff all over here wchar_t window_text_WIDE[512]{0}; GetWindowTextW(hwnd, window_text_WIDE, 512LL); char window_text_asci[3072]{0}; WideCharToMultiByte(65001LL, 0LL, window_text_WIDE, 0xFFFFFFFFLL, window_text_asci, 3072, 0LL); char window_class_name[256]{0}; GetClassNameA(hwnd, window_class_name, 256LL); RECT window_rect; GetWindowRect(hwnd, &window_rect); const auto window_gwl_style = GetWindowLongA(hwnd, GWL_STYLE); const auto window_gwl_ex_style = GetWindowLongA(hwnd, GWL_EXSTYLE); DWORD display_affinity = 0; GetWindowDisplayAffinity(hwnd, &display_affinity); // adds these strings to the buffer directly ac_string_encrypt(encrypted_string_thing, window_text_asci); ac_string_encrypt(encrypted_string_thing, window_class_name); // store info ac_fmt_sprint_encrypt(encrypted_string_thing, 32, "%li", window_rect.left); ac_fmt_sprint_encrypt(encrypted_string_thing, 32, "%li", window_rect.top); ac_fmt_sprint_encrypt(encrypted_string_thing, 32, "%li", window_rect.right); ac_fmt_sprint_encrypt(encrypted_string_thing, 32, "%li", window_rect.bottom); ac_fmt_sprint_encrypt(encrypted_string_thing, 32, "%li", window_gwl_style); ac_fmt_sprint_encrypt(encrypted_string_thing, 32, "%li", window_gwl_ex_style); ac_fmt_sprint_encrypt(encrypted_string_thing, 32, "%lu", display_affinity); DWORD pid = 0; if (GetWindowThreadProcessId(hwnd, &pid)) { ac_log_cached_window_process(pid, encrypted_string_thing); } else { // assuming encrypted failure message, logs the current process id instead. } } void ac_process_cached_windows() { // lots of encryption stuff here char* encrypted_string_thing = (char*)malloc(0x40000); for (unsigned int i = 0; i < cached_window_count; ++i) { // lots of encryption stuff here, and ptr modifications ac_handle_window(cached_windows[i], encrypted_string_thing); } // lots of encryption stuff here, and ptr modifications ac_send_data_to_server(encrypted_string_thing); free(encrypted_string_thing); // lots of encryption stuff here } -
-
Example data. TAC will format in json with modules hashed.
示例数据。TAC 将以 json 格式进行格式化,模块使用哈希。
NVIDIA GeForce Overlay - Window Text
CEF-OSC-WIDGET - Window Class
0 - Left
0 - Top
2560 - Right
1440 - Bottom
-1811939328 - window_gwl_style
134742184 - window_gwl_ex_style
0 - display_affinity
Loaded Modules:
C:\Program Files\NVIDIA Corporation\NVIDIA GeForce Experience\NVIDIA Share.exe
C:\Windows\SYSTEM32\ntdll.dll
C:\Windows\System32\KERNEL32.DLL
C:\Windows\System32\KERNELBASE.dll
C:\Windows\System32\SHLWAPI.dll
C:\Windows\System32\msvcrt.dll
C:\Windows\System32\WS2_32.dll
C:\Windows\SYSTEM32\urlmon.dll
C:\Windows\System32\RPCRT4.dll
C:\Windows\System32\CRYPT32.dll
C:\Windows\System32\ucrtbase.dll
C:\Windows\System32\USER32.dll
C:\Windows\System32\win32u.dll
C:\Windows\SYSTEM32\iertutil.dll
C:\Windows\System32\GDI32.dll
C:\Windows\SYSTEM32\srvcli.dll
C:\Windows\System32\combase.dll
C:\Windows\System32\gdi32full.dll
C:\Windows\System32\msvcp_win.dll
C:\Windows\System32\sechost.dll
C:\Windows\SYSTEM32\netutils.dll
C:\Windows\System32\advapi32.dll
C:\Windows\System32\SHELL32.dll
C:\Windows\System32\shcore.dll
C:\Windows\System32\ole32.dll
C:\Windows\System32\OLEAUT32.dll
C:\Program Files\NVIDIA Corporation\NVIDIA GeForce Experience\libcef.dll
C:\Windows\System32\WINTRUST.dll
C:\Windows\SYSTEM32\wlanapi.dll
C:\Windows\System32\COMDLG32.dll
C:\Windows\SYSTEM32\dxgi.dll
C:\Windows\SYSTEM32\IPHLPAPI.DLL
C:\Windows\System32\IMM32.dll
C:\Windows\SYSTEM32\UxTheme.dll
C:\Windows\SYSTEM32\CRYPTUI.dll
C:\Windows\SYSTEM32\MSIMG32.dll
C:\Windows\SYSTEM32\WINMM.dll
C:\Windows\SYSTEM32\d3d11.dll
C:\Windows\SYSTEM32\Secur32.dll
C:\Windows\SYSTEM32\NETAPI32.dll
C:\Windows\SYSTEM32\d3d9.dll
C:\Windows\System32\bcrypt.dll
C:\Windows\SYSTEM32\OLEACC.dll
C:\Windows\SYSTEM32\dwmapi.dll
C:\Windows\SYSTEM32\WTSAPI32.dll
C:\Program Files\NVIDIA Corporation\ShadowPlay\nvspapi64.dll
C:\Windows\SYSTEM32\ntmarta.dll
C:\Program Files\NVIDIA Corporation\NvContainer\libprotobuf.dll
C:\Windows\SYSTEM32\MSVCP140.dll
C:\Windows\SYSTEM32\VCRUNTIME140.dll
C:\Windows\SYSTEM32\VCRUNTIME140_1.dll
C:\Program Files\NVIDIA Corporation\ShadowPlay\IpcCommon64.dll
C:\Program Files\NVIDIA Corporation\NvContainer\MessageBus.dll
C:\Windows\System32\NSI.dll
C:\Windows\System32\MSCTF.dll
C:\Windows\system32\NLAapi.dll
C:\Windows\SYSTEM32\dhcpcsvc6.DLL
C:\Windows\SYSTEM32\DNSAPI.dll
C:\Windows\SYSTEM32\WINSTA.dll
C:\Windows\System32\clbcatq.dll
C:\Windows\System32\MMDevApi.dll
C:\Windows\SYSTEM32\mscms.dll
C:\Windows\SYSTEM32\ColorAdapterClient.dll
C:\Windows\System32\Windows.UI.dll
C:\Windows\System32\WindowManagementAPI.dll
C:\Windows\System32\TextInputFramework.dll
C:\Windows\System32\InputHost.dll
C:\Windows\SYSTEM32\wintypes.dll
C:\Windows\SYSTEM32\twinapi.appcore.dll
C:\Windows\System32\CoreMessaging.dll
C:\Windows\System32\CoreUIComponents.dll
C:\Windows\system32\twinapi.dll
C:\Windows\system32\apphelp.dll
C:\Program Files\NVIDIA Corporation\NVIDIA GeForce Experience\cef\common\OverClocking.dll
C:\Program Files\NVIDIA Corporation\NVIDIA GeForce Experience\dependencies\CrimsonUtil.dll
C:\Windows\SYSTEM32\POWRPROF.dll
C:\Windows\SYSTEM32\UMPDC.dll
C:\Program Files\NVIDIA Corporation\NVIDIA GeForce Experience\cef\share\MessageBusRouter.dll
C:\Windows\SYSTEM32\nvapi64.dll
C:\Windows\System32\SETUPAPI.dll
C:\Windows\SYSTEM32\FvSDK_x64.dll
C:\Windows\system32\mswsock.dll
C:\Windows\System32\rasadhlp.dll
C:\Windows\System32\fwpuclnt.dll
C:\Windows\SYSTEM32\xinput1_4.dll
C:\Windows\SYSTEM32\dxcore.dll
What about tools like Cheat Engine? 像 Cheat Engine 这样的工具怎么样?
-
Cheat Engine is one of the easiest programs to detect, and it’s really because of how virtual memory works in Windows.
Cheat Engine 是最容易被检测的程序之一,这真的归因于 Windows 中虚拟内存的工作方式。 -
Whenever a program wants to allocate virtual memory, they’re going to call the Windows API
VirtualAlloc
.
每当程序想要分配虚拟内存时,它们都会调用 Windows API VirtualAlloc。
-
This memory is allocated, but it’s not backed by any physical memory yet because it hasn’t been accessed, this is a feature in the Windows kernel.
这段内存已经被分配,但目前还没有物理内存支持,因为它还没有被访问到,这是 Windows 内核的一个特性。 -
This allows the game to allocate virtual memory with that function and never use it.
这个功能允许游戏分配虚拟内存,但从未使用它。 -
After Cheat Engine scans the process, it will hit this virtual memory, which will then make that memory valid, because now it has been accessed by Cheat Engine.
在 Cheat Engine 扫描进程后,它会访问这块虚拟内存,从而使该内存变得有效,因为现在它已经被 Cheat Engine 访问过了。
- Here’s how that detection would look, and this is for any memory scanner, not just Cheat Engine. This will also include the Process Hacker memory tab.
这是检测的方式,这适用于任何内存扫描器,不仅仅是 Cheat Engine。这还将包括 Process Hacker 的内存标签。
void run_honey_pot_violation(fn callback) { // the protection won't matter const auto allocated_virtual_memory = VirtualAlloc(nullptr, 0x1000, MEM_COMMIT | MEM_RESERVE, PAGE_READWRITE); PSAPI_WORKING_SET_EX_INFORMATION working_set_information; memset(&working_set_information, 0, sizeof(working_set_information)); working_set_information.VirtualAddress = allocated_virtual_memory; while (true) { // query about the current process const auto did_it_work = K32QueryWorkingSetEx((HANDLE)-1, &working_set_information, sizeof(working_set_information)); if (did_it_work && (working_set_information.VirtualAttributes.Flags & 1) != 0 ) { printf("XD CHEAT ENGINE DETECTED HAHAHAH\n"); callback(); } // just an example timer, not what the game does Sleep(1000); } } - Here’s how that detection would look, and this is for any memory scanner, not just Cheat Engine. This will also include the Process Hacker memory tab.
-
Anti-Sig Scanning 反签名扫描
-
Game hackers love signatures; whenever the game updates, no problem the cheat will automatically update.
游戏黑客喜欢使用签名;每当游戏更新时,作弊程序会自动更新。
-
Treyarch had a pretty interesting idea.
Treyarch 有一个挺有趣的 idea。-
Their idea is to create a function that’ll never be called again; this function will call another function that protects the return address with PAGE_NOACCESS. Since this will never be reached again by the program, this isn’t an issue.
他们的想法是创建一个永远不会被再次调用的功能;这个功能会调用另一个功能,该功能会使用 PAGE_NOACCESS 保护返回地址。由于程序不会再到达这里,因此这不是一个问题。 -
The way sig scanners work is they attempt to match a signature by reading bytes in the executable. It’s extremely slow to query each byte you are going to be reading, which is why this is such a good method. You can read more about VirtualProtect
here
.
sig 扫描器的工作方式是通过读取可执行文件的字节来匹配签名。逐个查询每个将要读取的字节是非常慢的,这也是为什么这种方法如此有效的原因。你可以在这里了解更多关于 VirtualProtect 的内容。
- It’s not undefeatable, but it’s something that’s there and will probably give most a hard time.
它不是无懈可击的,但它是存在的,很可能会给大多数人带来很大的困难。
- It’s not undefeatable, but it’s something that’s there and will probably give most a hard time.
void enable_anti_sig_scanning(fn callback) { DWORD old = 0; const auto cpu_stamp = __rdtsc(); unsigned __int64 protect_location = reinterpret_cast<unsigned __int64>(_ReturnAddress()); if ( (protect_location & cpu_stamp) + (protect_location | cpu_stamp) - (protect_location + cpu_stamp) ) { if ( (cpu_stamp & 1) == 0 ) { protect_location = (protect_location + 5120) & 0xFFFFFFFFFFFFF000uLL; } if (!VirtualProtect(reinterpret_cast<void*>(protect_location), 1, PAGE_NOACCESS, &old) ) { // this is here just to detect someone hooking VirtualProtect and returning false on PAGE_NOACCESS callback(); } } }- Here’s a good example of code that’ll never be reached again. (The program will never reach the top of the main function again.)
这里是一个永远不会再次被执行的代码示例。(程序将不会再回到主函数的顶部。)
int main(int argc, const char** argv) { enable_anti_sig_scanning(); scan_pattern(GetModuleHandleA(nullptr), "xxsaj3"); // pretend this is a signature that's far into the executable }- The scan pattern function will start at the base of the executable and continue to the end until it finds the pattern it wants, ultimately hitting the PAGE_NOACCESS memory, and crashing the process.
扫描模式功能将从可执行文件的底部开始,继续扫描直到找到它想要的模式,最终触及 PAGE_NOACCESS 内存,并导致进程崩溃。
-
-
Anti-Debugging 反调试
-
TAC has a simple anti-debug check; but remember, Arxan is still running, so they still have all of those anti-debugging tricks.
TAC 有一个简单的反调试检查;但记住,Arxan 仍在运行,所以它们仍然拥有所有的反调试技巧。-
How does TAC prevent debugging?
TAC 如何防止调试?
- TAC loops through all threads in the current process by using CreateToolHelpSnapshot32 with SnapThread passed and checks the thread for a DebugObject, which is going to be present if a debugger is running.
TAC 通过使用 CreateToolHelpSnapshot32 并传递 SnapThread 来遍历当前进程中的所有线程,并检查线程是否存在 DebugObject,如果有调试器运行,DebugObject 将存在。
void ac_loop_threads_debug(fn callback) { HANDLE snapshot = CreateToolhelp32Snapshot(TH32CS_SNAPTHREAD, GetCurrentProcessId()); THREADENTRY32 te32{}; te32.dwSize = sizeof(te32); do { if (te32.th32OwnerProcessID != GetCurrentProcessId()) { continue; } const HANDLE thread_handle = OpenThread(THREAD_ALL_ACCESS, FALSE, te32.th32ThreadID); if (thread_handle) { HANDLE debug_object_handle = INVALID_HANDLE_VALUE; ULONG ret_length = 0; THREAD_BASIC_INFORMATION thread_basic_information; if (!NtQueryInformationThread(thread_handle, 0, &thread_basic_information, sizeof(thread_basic_information), &ret_length)) { if (thread_basic_information.TebBaseAddress) { if (thread_basic_information.TebBaseAddress->DbgSsReserved[1]) { debug_object_handle = HANDLE(thread_basic_information.TebBaseAddress->DbgSsReserved[1]); } } } if (debug_object_handle != INVALID_HANDLE_VALUE) { callback(); } CloseHandle(thread_handle); } } while (Thread32Next(snapshot, &te32)); CloseHandle(snapshot); } - TAC loops through all threads in the current process by using CreateToolHelpSnapshot32 with SnapThread passed and checks the thread for a DebugObject, which is going to be present if a debugger is running.
-
A weird anti-debug trick.
一个奇怪的反调试技巧。
- It throws an access violation by writing to invalid memory; if the code ever gets past the exception, a debugger got past it or handled the exception properly.
它通过写入无效内存来抛出访问违规;如果代码 ever 能够越过异常,调试器要么超过了它,要么正确地处理了异常。
void ac_exception_anti_debug(fn callback) { // this is writing to invalid memory and will throw an access violation __sidt((void *)0xFFFFFF8000000900LL); callback(); // this should never be reached } - It throws an access violation by writing to invalid memory; if the code ever gets past the exception, a debugger got past it or handled the exception properly.
-
Standard API check
标准 API 检查
__forceinline void ac_check_remote_debugger(callback cb)
{
  BOOL dbg = false;
  if (CheckRemoteDebuggerPresent((HANDLE)-1, &dbg))
  {
    if (dbg)
    {
      cb();
      // the process will close
    }
  }
}

ThreadHideFromDebugger sends exceptions to the process instead of the debugger which means
whenever the debugger attempts to pause the process, a STATUS_BREAKPOINT exception will go off which will close the process.
The best part about this is you can not unset the ThreadHideFromDebugger flag once its been set from user mode, this tactic runs in their tls callback which is before the entry point of the exe.
```c++
__forceinline void ac_hide_current_thread()
{
  char use_ThreadHideFromDebugger = 1;
    nt_set_information_thread((HANDLE)-2, ThreadHideFromDebugger, (void**)&use_ThreadHideFromDebugger, 0);
}
-
Monitoring Network Traffic 监控网络流量
-
This is a super cool detection method used for some cheats, and don’t be alarmed by this; they do not store any of your active connections; they are only looking for a very specific check.
这是一款用于检测某些作弊行为的超酷方法,不要对此感到 alarmed;它们不会存储你的任何活跃连接;他们只是在寻找一种非常特定的检查。
-
A cheater can write shellcode into the game process that starts a network server inside of the game process on the local network, then the cheater can have their external application send and receive information to this local server, kind of like a local command and control center.
作弊者可以在游戏进程中编写 shellcode,从而在游戏进程中启动一个局域网内的网络服务器,然后作弊者可以让他们外部的应用程序向这个本地服务器发送和接收信息,有点像一个本地的命令和控制中心。
- Here’s how it’s implemented.
这是它的实现方式。
// custom tac struct struct tcp_entry { DWORD OwningPid; DWORD LocalAddr; DWORD RemoteAddr; DWORD LocalPort; DWORD RemotePort; }; void ac_detect_local_command_center(fn callback) { // WSA must be the first call before any other Windows socket functions can be called successfully WSAData data; WSAStartup(MAKEWORD(2, 2), &data); bool successfully_looped_tcp_table = false; __int64 tcp_table_container[3]{}; // allocate the table auto table = static_cast<PMIB_TCPTABLE2>(malloc(sizeof(MIB_TCPTABLE2))); // get the tcp table size, the first call is expected to fail ULONG size; auto result = GetTcpTable2(table, &size, 1); if (result == ERROR_INSUFFICIENT_BUFFER) { free(table); table = static_cast<PMIB_TCPTABLE2>(malloc(size)); } // store the tcp table into our newly allocated buffer result = GetTcpTable2(table, &size, 1); if (!result) // it returns NO_ERROR which is 0x0 on success { for (auto i64 = 0; i64 < static_cast<signed int>(table->dwNumEntries); ++i64) { // store each entry PMIB_TCPROW2 tableptr = &table->table[i64]; if (!static_cast<unsigned __int8>(add_tcp_entry(tableptr, tcp_table_container))) break; } successfully_looped_tcp_table = true; } // memory is no longer needed free(table); if (successfully_looped_tcp_table) { // get the current process id const auto current_process_id = GetCurrentProcessId(); tcp_entry* tcp_table; init_tcp_table_entry(&tcp_table); tcp_entry* dummy; // loop the tcp table for (tcp_table = *get_tcp_table_entry(tcp_table_container, &dummy);; increment_tcp_table_entry(&tcp_table)) { auto next_tcp_entry = get_next_tcp_entry(tcp_table_container, &dummy); // break if we are just comparing the same entry if (!tcp_entires_different(&tcp_table, next_tcp_entry)) break; auto tcp_ptr = get_tcp_ptr(&tcp_table); // verify the entry was created by the current process if (tcp_ptr->OwningPid == current_process_id) { // get the other entries tcp_entry* entry2; init_tcp_table_entry(&entry2); for (entry2 = *get_tcp_table_entry(tcp_table_container, &dummy); ; increment_tcp_table_entry(&entry2)) { auto next_entry2 = get_next_tcp_entry(tcp_table_container, &dummy); // we have relooped back to the start, break if (!tcp_entires_different(&entry2, next_entry2)) break; auto entry2_tcp_ptr = get_tcp_ptr(&entry2); /* if the entrys port and the one found inside the current process match and they aren't owned by the same process */ if (entry2_tcp_ptr->LocalPort == tcp_ptr->RemotePort && entry2_tcp_ptr->OwningPid != tcp_ptr->OwningPid) { // flagged callback(); } } } } } } - Here’s how it’s implemented.
-
Encrypted Custom Syscalls 加密自定义系统调用
-
Whenever you look at exported APIs in ntdll, you’ll notice most of them do a syscall.
每当您查看 ntldl 导出的 API 时,您会注意到大多数 API 都会进行系统调用。 -
A syscall is what moves over into the kernel, where the actual implementation of the function is.
系统调用是将功能的实际实现移入内核的过程。 -
This is what a syscall stub looks like.
这是一个系统调用 stub 的样子。 -
IMO this is the coolest feature TAC has!
IMO 这是 TAC 最酷的功能!
; rcx is used by the kernel as a jump back location for the syscall instruction. ; rcx needs to be stored so the kernel can use it. mov r10, rcx ; eax holds the syscall index which the kernel looks up in the table of system calls mov eax, 0x11B syscall ret -
Writing your own syscall stub has a purpose. Whenever a user-mode cheat hooks those ntdll functions that syscall, it’ll work, but their hooks can be bypassed very easily if the anti-cheat just calls the syscall instruction with eax set to the same syscall index as the normal function.
编写自己的 syscall stub 有其目的。每当用户模式的作弊软件钩住那些通过 syscall 调用的 ntdll 函数时,这些钩住可以正常工作,但如果反作弊软件只是将 eax 设置为与正常函数相同的 syscall 索引并调用 syscall 指令,那么这些钩住可以非常容易地被绕过。 -
Syscalls are vulnerable to instrumentation callbacks; these are callbacks coded into Windows, and they will work on every single user-mode process.
系统调用容易受到仪器回调的影响;这些回调是编码在 Windows 中的,它们可以作用于每一个用户模式进程。 -
These callbacks will catch every syscall instruction and every exception.
这些回调将捕获每一条系统调用指令和每一个异常。
- Just an FYI, instrumentation callbacks are called AFTER the syscall; their return address will be right after the syscall instruction.
只需告知一下,仪器化回调在系统调用之后被调用;它们的返回地址将在系统调用指令之后。 - This would normally allow cheaters to easily see where every syscall is coming from since all of the functions using it are just exported in ntdll.
这通常会使作弊者轻松地看到每个系统调用来自哪里,因为所有使用它的函数都在 ntdll 中导出。 - It fails because the cheater will see a syscall from a random ntdll function, rather than the anti-cheat code.
它失败的原因是作弊者会看到一个来自随机的 ntdll 函数的系统调用,而不是反作弊代码。
- Just an FYI, instrumentation callbacks are called AFTER the syscall; their return address will be right after the syscall instruction.
-
If you want to see instrumentations in action, you can do so here.
如果你想查看仪表盘的实际操作,你可以在下面看到。
Let’s take a look at TAC’s custom syscall stub.
让我们来看一下 TAC 的自定义系统调用 stub。 
- At a quick glance, this is very confusing and hard to figure out statically.
初看之下,这非常混乱,静态分析很难搞清楚。 - They even make it confusing to see what memory is being written to.
他们甚至让查看正在写入的内存变得混淆。
some_random_text_encrypted_func[0] = ((unsigned __int64)&loc_7FF60E12D0B0 + 4095) & 0xFFFFFFFFFFFFF000uLL;
- It turned out to be pretty simple to figure this out and understand exactly how it works.
原来弄清楚这一点并完全理解它是如何工作的非常简单。 - That memory being written to is actually a large chunk allocated in the .text section that they just virtual protect for write/execute rights.
那块内存实际上是分配在.text 段中的一个大块,他们刚刚为其赋予了写/执行的虚拟保护权限。 - Now we could spend all day in our XOR calculator and try to build the byte array of these XOR encrypted instructions ourselves.
现在我们可以一整天都在我们的异或计算器中度过,并尝试自己构建这些异或加密指令的字节数组。 - Or we could just let the computer do it….
或者我们可以让计算机来做这件事……
This was pretty much just copy and paste from IDA Pro, all I did was allocate my own memory here.
这基本上就是从 IDA Pro 复制粘贴过来的,我在这里只是分配了自己的内存。
	auto v3867 = 12288LL;
	LABEL_1798:
	auto v2168 = __rdtsc() % (v3867 - 3);
	auto v1328 = v2168;
	auto ac_NtReadFile_1 = (char*)GetProcAddress(GetModuleHandleA("ntdll"), "NtReadFile");
	__int64 i67 = 0;
	for (i67 = 0LL; ; ++i67)
	{
		if (v1328 + i67 >= v3867)
			goto LABEL_1798;
		if (ac_NtReadFile_1[i67 + 1 + v1328] == 5
			&& (unsigned __int8)ac_NtReadFile_1[i67 + 2 + v1328] == 195
			&& ac_NtReadFile_1[i67 + v1328] == 15)
		{
			break;
		}
	}

	auto nt_read_file_syscall_instruction = &ac_NtReadFile_1[i67 + v1328];
	volatile __int64 syscall_stub_memory = (__int64)VirtualAlloc(nullptr, 0x4096, MEM_COMMIT | MEM_RESERVE, PAGE_EXECUTE_READWRITE);

	__int64 syscall_index = 0; // this is going to be the syscall index; it's 0 here just while I'm explaining
	auto offset_that_doesnt_matter = 0x50; // it's just here to add to the confusion; this can be any number above 4

	*(_QWORD*)(syscall_stub_memory + offset_that_doesnt_matter + 28LL) = (__int64)nt_read_file_syscall_instruction;
	*(_QWORD*)(syscall_stub_memory + offset_that_doesnt_matter + 20LL) = 0x63B4B73DD1E509A9LL;
	*(_QWORD*)(syscall_stub_memory + offset_that_doesnt_matter + 20LL) ^= 0x7FA6B73DD1E72C56uLL;
	*(_DWORD*)(syscall_stub_memory + offset_that_doesnt_matter + 12LL) = syscall_index;
	*(_DWORD*)(syscall_stub_memory + offset_that_doesnt_matter + 8LL) = -997864955;
	*(_DWORD*)(syscall_stub_memory + offset_that_doesnt_matter + 8LL) ^= 0x7CEB6A07u;
	*(_DWORD*)(syscall_stub_memory + offset_that_doesnt_matter) = -1006268688;
	*(_DWORD*)(syscall_stub_memory + offset_that_doesnt_matter) ^= 0x62ADC0BFu;
	*(_DWORD*)(syscall_stub_memory + offset_that_doesnt_matter + 4LL) = -1637542171;
	*(_DWORD*)(syscall_stub_memory + offset_that_doesnt_matter + 4LL) ^= 0x75B49DA9u;
	*(_DWORD*)(syscall_stub_memory + offset_that_doesnt_matter + 16LL) = 109211239;
	*(_DWORD*)(syscall_stub_memory + offset_that_doesnt_matter + 16LL) ^= 0xBBCA6C8C;


	auto syscall_stub_ptr = (__int64(__fastcall*)(_QWORD, _QWORD, _QWORD, _QWORD))(syscall_stub_memory + offset_that_doesnt_matter + 4LL);
    printf("memory allocated: %p\n", syscall_stub_ptr);
    getchar();
Inspecting this memory address reveals the unencrypted shellcode and we can see the standard syscall stub here.
检查这个内存地址会显示未加密的壳代码,我们可以看到标准的系统调用 stub 在这里。
Starting with the “mov r10, rcx” instruction.
从“mov r10, rcx”指令开始。
Following that jmp after the mov, 0x2C is the NtTerminateProcess syscall index for my Windows version, and we can see that being moved into eax.
在那条 jmp 之后的 mov 指令中,0x2C 是我版本的 Windows NtTerminateProcess 系统调用索引,并且我们可以看到它被移动到了 eax 中。
Following the jump after mov eax, this is where the address of the syscall instruction comes in; it’s just a jump to it.
跟随 mov eax 后的跳转,这里就是 syscall 指令地址出现的地方;它只是一个跳转到该指令。
Syscall instruction. 系统调用指令。 
We can take a look at where this syscall instruction is located, just to verify that it’s a bit random.
我们可以查看这条系统调用指令的位置,以验证它是否有点随机。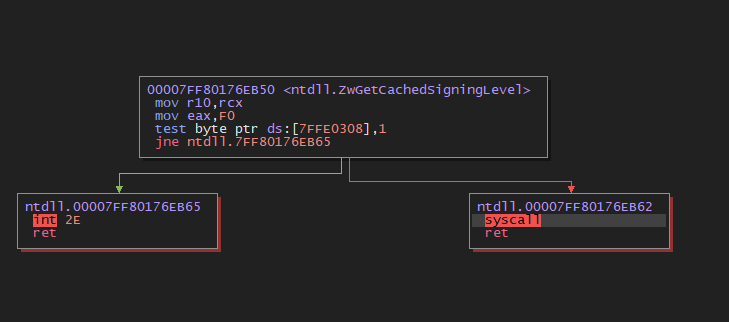
And just to double-check, if we run the code again, our syscall instruction location will change!
为了再次确认,如果我们再运行一遍代码,syscall 指令的位置将会改变!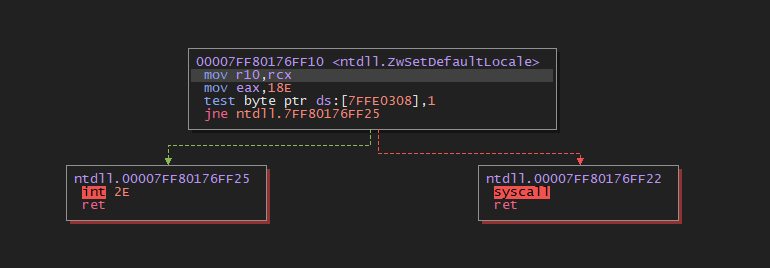
- This is a lot, so let’s recap quickly.
这很多,所以让我们快速回顾一下。 - Why would you use a custom syscall stub?
为什么你会使用自定义的系统调用 stub?- This will completely bypass cheaters hooking ntdll functions.
这将完全绕过通过挂钩 ntdll 函数的作弊行为。
- This will completely bypass cheaters hooking ntdll functions.
- What’s going on with the NtReadFile stuff?
NtReadFile 怎么回事?- TAC is actually searching for the syscall instruction; their encrypted syscall stub is designed to actually fake where syscalls are coming from, the CPU time is the RNG factor.
TAC 实际上是在搜索系统调用指令;它们的加密系统调用 stub 实际上是为了伪造系统调用的来源,CPU 时间是随机数生成因子。 - Example: Someone monitoring the process will see that a syscall happened from NtReadFile, so they’ll do some inspecting and try to cover up anything NtReadFile would expose of theirs, but the syscall wasn’t even NtReadFile. The actual syscall could have been anything; the cheater will never know unless they’re able to inspect the eax register after the syscall (which should be cleared out and replaced with the NTSTATUS code). This is really cool; an attacker won’t have any way of knowing what syscall instruction to monitor.
有人监控这个过程会看到发生了 NtReadFile 系统调用,于是他们会检查并试图掩盖 NtReadFile 暴露的信息,但实际发生的是一个完全不同的系统调用,根本不是 NtReadFile。实际发生的是什么系统调用,作弊者永远都不会知道,除非他们能在系统调用后检查 eax 寄存器的内容(系统调用后 eax 应该被清空并替换为 NTSTATUS 代码)。这真的很酷,攻击者根本不知道需要监控哪个系统调用指令。
- TAC is actually searching for the syscall instruction; their encrypted syscall stub is designed to actually fake where syscalls are coming from, the CPU time is the RNG factor.
- A good way to monitor these would be preventing page execute protections, and looking at the exception, this is what the stub looks like in Ida Pro.
监测这些的一种好方法是防止页面执行保护,并查看异常,这就是在 IDA Pro 中 stub 的样子。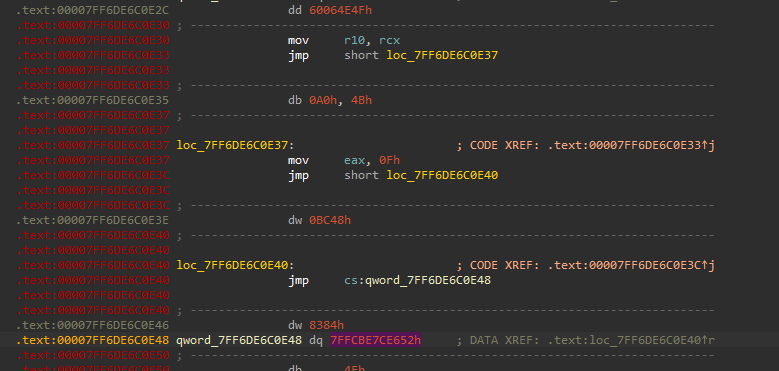
Just for bonus points, I’ve recreated their syscalling method.
只是为了额外的分数,我重新创建了他们的系统调用方法。
__forceinline int get_syscall_index(unsigned __int64 address)
{
	return *(int*)&reinterpret_cast<char*>(address)[4];
}

__forceinline __int64 get_syscall_instruction_address(unsigned __int64 func)
{
	const auto distance = 12288LL;
LABEL_1798:
	const auto starting_distance = __rdtsc() % (distance - 3);
	auto ntdll_exported_func = reinterpret_cast<char*>(func);

	__int64 syscall_instruction_spot = 0;
	for (syscall_instruction_spot = 0LL; ; ++syscall_instruction_spot)
	{
		if (starting_distance + syscall_instruction_spot >= distance)
			goto LABEL_1798;
		if (ntdll_exported_func[syscall_instruction_spot + 1 + starting_distance] == 5
			&& (unsigned __int8)ntdll_exported_func[syscall_instruction_spot + 2 + starting_distance] == 195
			&& ntdll_exported_func[syscall_instruction_spot + starting_distance] == 15)
		{
			break;
		}
	}

	return reinterpret_cast<unsigned __int64>(&ntdll_exported_func[syscall_instruction_spot + starting_distance]);
}

__forceinline void* generate_syscall_stub(unsigned __int64 syscall_instruction, const int syscall_index, void** base, int* size)
{
	if (base == nullptr || size == nullptr)
	{
		return nullptr;
	}

	*size = 0x4096;

	auto offset = rand() % (*size - 0x40);

    // using virtual allocated memory just for the example, game has a .text blob allocated for this
	volatile __int64 syscall_stub_memory = reinterpret_cast<__int64>(VirtualAlloc(nullptr, *size, MEM_COMMIT | MEM_RESERVE, PAGE_EXECUTE_READWRITE));
	*(_QWORD*)(syscall_stub_memory + offset + 28LL) = (__int64)syscall_instruction;
	*(_QWORD*)(syscall_stub_memory + offset + 20LL) = 0x63B4B73DD1E509A9LL;
	*(_QWORD*)(syscall_stub_memory + offset + 20LL) ^= 0x7FA6B73DD1E72C56uLL;
	*(_DWORD*)(syscall_stub_memory + offset + 12LL) = syscall_index;
	*(_DWORD*)(syscall_stub_memory + offset + 8LL) = -997864955;
	*(_DWORD*)(syscall_stub_memory + offset + 8LL) ^= 0x7CEB6A07u;
	*(_DWORD*)(syscall_stub_memory + offset) = -1006268688;
	*(_DWORD*)(syscall_stub_memory + offset) ^= 0x62ADC0BFu;
	*(_DWORD*)(syscall_stub_memory + offset + 4LL) = -1637542171;
	*(_DWORD*)(syscall_stub_memory + offset + 4LL) ^= 0x75B49DA9u;
	*(_DWORD*)(syscall_stub_memory + offset + 16LL) = 109211239;
	*(_DWORD*)(syscall_stub_memory + offset + 16LL) ^= 0xBBCA6C8C;

	*base = reinterpret_cast<void*>(syscall_stub_memory);
	return reinterpret_cast<void*>(syscall_stub_memory + offset + 4LL);
}

__forceinline void free_syscall_stub(void* base, int size)
{
	memset(base, 0, size);
	VirtualFree(base, 0, MEM_RELEASE);
}

template<typename... Params>
__forceinline NTSTATUS spoof_syscall(unsigned __int64 exported_ntdll_function, unsigned __int64 function_to_call, Params... params)
{
	void* base_address_of_stub = nullptr;
	int stub_size = 0;

	const auto nt_syscall_instruction = get_syscall_instruction_address(exported_ntdll_function);
	const auto syscall_index = get_syscall_index(function_to_call);
	void* stub = generate_syscall_stub(nt_syscall_instruction, syscall_index, &base_address_of_stub, &stub_size);

	NTSTATUS result = reinterpret_cast<NTSTATUS(__fastcall*)(Params...)>(stub)(params...);

	free_syscall_stub(base_address_of_stub, stub_size);
	return result;
}

__forceinline void terminate_process()
{
	const auto syassasd = reinterpret_cast<unsigned __int64>(GetProcAddress(LoadLibraryA("ntdll"), "NtTerminateProcess"));
	const auto spoof_start = reinterpret_cast<unsigned __int64>(GetProcAddress(LoadLibraryA("ntdll"), "NtOpenFile"));
	spoof_syscall(spoof_start, syassasd, static_cast<HANDLE>(-1), 1337);
}

int main(int argc, const char** argv)
{
	terminate_process();
}
Let’s test this just to make sure.
让我们测试一下以确保无误。
- We can see this is working exactly how it should! Again, this is clever and even more effective; cheaters will have no clue which syscall instruction to watch out for.
我们可以看到这正是它应有的工作方式!再次强调,这很巧妙,甚至更加有效;作弊者根本不知道需要注意哪个系统调用指令。
Detecting Anti-Debugger-Hiding Attempts 检测反调试隐藏尝试
-
It’s common for anti-debugging or anti-cheat threads to set
ThreadHideFromDebuggerto true.
反调试或反作弊线程常将ThreadHideFromDebugger设置为 true。-
Whenever a thread has
ThreadHideFromDebuggerset, any exceptions thrown from that thread will skip past a debugger and crash the process or be handled in the process’s structured exception handling.
每当线程设置了ThreadHideFromDebugger标志,该线程抛出的任何异常将绕过调试器并导致进程崩溃,或者由进程的结构化异常处理程序处理。 -
Which means this flag is pretty important, and you want to make sure someone isn’t spying on your activity.
这意味着这面旗帜非常重要,你想要确保没有人监视你的活动。 -
TAC has a pretty interesting approach to detecting hooks for this.
TAC 对于检测钩子有相当有趣的 approach。
- To set
ThreadHideFromDebugger, the APINtSetInformationThreadmust be called.
要设置ThreadHideFromDebugger,必须调用 APINtSetInformationThread。 - Cheaters can hook this and just return TRUE whenever
ThreadHideFromDebuggeris being requested. This will make the anti-cheat think it has been successfully hidden even though nothing happened.
作弊者可以利用这一点,在每当请求ThreadHideFromDebugger时总是返回 TRUE。这会让反作弊系统误以为已经成功隐藏了,但实际上并没有发生任何事情。 - This method detects poorly made hooks.
此方法检测制作不良的钩子。
#define ThreadHideFromDebugger 17 #define NT_SUCCESS(Status) (((NTSTATUS)(Status)) >= 0) __forceinline void ac_detect_hidden_thread(callback cb) { HANDLE current_thread_handle = (HANDLE)-2; char use_ThreadHideFromDebugger = 0; // this call will fail because NtSetInformationThread returns // STATUS_INFO_LENGTH_MISMATCH if the length parameter is set // if it doesn't fail, then this function has been poorly hooked NTSTATUS query_result_1 = nt_set_information_thread( current_thread_handle, ThreadHideFromDebugger, (void**)&use_ThreadHideFromDebugger, 1); if (NT_SUCCESS(query_result_1)) { printf("fake call passed\n"); cb(); } // this should return 0 always // when running under a debugger with ScyllaHide, this returns 0xC000005. NTSTATUS query_result_2 = nt_set_information_thread(current_thread_handle, ThreadHideFromDebugger, 0LL, 0LL); if (query_result_2 < 0) { printf("second call failed\n"); cb(); } // this will catch hooks that do not check the size properly // NtQueryInformationThread expects the size to be 1, not 4. // 4 is sizeof(BOOL) vs sizeof(bool), which is 1. NTSTATUS query_result_3 = nt_query_information_thread( current_thread_handle, ThreadHideFromDebugger, (void**)&use_ThreadHideFromDebugger, 4LL, NULL); if (NT_SUCCESS(query_result_3)) { printf("third call succeeded\n"); cb(); } // this call just passes a fake handle to check // for a hook returning success whenever ThreadHideFromDebugger is passed HANDLE fake_handle = (HANDLE)__rdtsc(); NTSTATUS query_result_4 = nt_set_information_thread(fake_handle, ThreadHideFromDebugger, 0LL, 0LL); if (NT_SUCCESS(query_result_3)) { printf("fourth call succeeded\n"); cb(); } } - To set
This is the result when running under x64dbg with ScyllaHide.
这是在 x64dbg 中运行并使用 ScyllaHide 时的结果。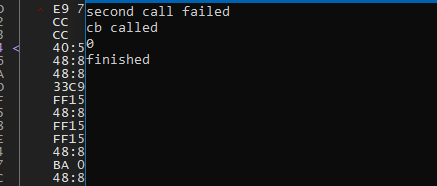
And this is the result without a debugger and without ScyllaHide.
这是在没有调试器且没有使用 ScyllaHide 时的结果。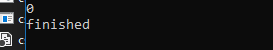
-
Create Remote Thread Blocking 创建远程线程阻塞
-
TAC installs an exception handler that just calls TerminateThread on the
STATUS_PRIVILEGED_INSTRUCTIONexception code.
TAC 安装了一个异常处理程序,该处理程序只是在接收到STATUS_PRIVILEGED_INSTRUCTION异常代码时调用 TerminateThread。 -
There’s a good reason for this; when cheaters manually map their DLL, they need a way to get the remote process to actually run the shellcode they wrote. One of the most common ways of doing this is CreateRemoteThread, which just allows the cheater to have a newly created thread that immediately executes their shellcode.
这是因为作弊者手动映射其 DLL 时,需要一种方法让远程进程实际运行他们编写的 shellcode。最常见的方法之一是使用 CreateRemoteThread,这仅仅允许作弊者创建一个新的线程,该线程会立即执行他们的 shellcode。-
How is it detected?:
它是如何检测到的?
- TLS callbacks are callbacks that can be planted inside of a Windows PE file; these callbacks are called before the thread’s entry point whenever a thread is created.
TLS 回调是可以在 Windows PE 文件中植入的回调;每当创建线程时,这些回调会在线程的入口点被调用之前被调用。
- TLS callbacks are callbacks that can be planted inside of a Windows PE file; these callbacks are called before the thread’s entry point whenever a thread is created.
Here’s how that works; keep in mind that we are running in the current thread context of the newly created thread.
这是如何工作的;请注意,我们是在新创建的线程的当前线程上下文中运行的。; this isn't exactly how the game does this ; anyways, this will still raise the STATUS_PRIVILEGED_INSTRUCTION exception. PUBLIC _priv_ins_exx .code _priv_ins_exx PROC mov rax, dr0 ; dr0 is privileged and we do not have access _priv_ins_exx ENDP ENDLONG WINAPI ac_vectored_handler(EXCEPTION_POINTERS* exptrs) { // this code is running in the same thread as the TLS callback if (exptrs->ExceptionRecord->ExceptionCode == STATUS_PRIVILEGED_INSTRUCTION) { // terminate the current thread TerminateThread(NtCurrentThread(), 1); return 0; } } VOID WINAPI tls_callback(PVOID DllHandle, DWORD Reason, PVOID Reserved) { if (Reason == DLL_THREAD_ATTACH) { // collect the threads start address __int64 start_address = 0; NtQueryInformationThread(NtCurrentThread(), ThreadQuerySetWin32StartAddress, &start_address, sizeof(start_address), nullptr); // assume the address is invalid until proven otherwise bool outside_of_valid_module = true; // loop the current loaded modules list const auto memory_module_list = &reinterpret_cast<nt::PTEB>(NtCurrentTeb())->ProcessEnvironmentBlock->Ldr->InMemoryOrderModuleList; for (PLIST_ENTRY p_list_entry = memory_module_list->Flink; p_list_entry != memory_module_list; p_list_entry = p_list_entry->Flink) { auto p_entry = CONTAINING_RECORD(p_list_entry, nt::LDR_DATA_TABLE_ENTRY, InMemoryOrderLinks); // this condition will be true as long as the start address is within a loaded dlls range. // example: memory such as 0x1E000000000 will not exist in any module (any memory from the result of a virtual alloc call will not be valid.) // while something like 0x7FFF12397591 could be inside of ntdll.dll if (start_address > reinterpret_cast<__int64>(p_entry->DllBase) && start_address < reinterpret_cast<__int64>(p_entry->DllBase) + p_entry->SizeOfImage) { outside_of_valid_module = false; break; } } // if we failed to prove the address is valid if (outside_of_valid_module) { callback(); // detection is stored and uploaded later _priv_ins_exx(); } } } -
Dumping Exception Handlers 抛出异常处理程序
For those interested in how I dumped the exception handlers, I’ve provided the code. You’ll need to update these offsets if you want to use this.
对于感兴趣了解我是如何处理异常的读者,我已经提供了相关代码。如果你想使用这段代码,需要更新这些偏移量。
void dump_exception_handlers()
{
  // 75 ? 4C 8D 9C 24 ? ? ? ? 48 8B C3 : mov xxx, rsi
  __int64 exception_filter = (__int64)GetModuleHandleA("kernelbase.dll") + 0x28CC60;
  auto rtl_decode_pointer = reinterpret_cast<__int64(__fastcall*)(__int64)>(get_address("ntdll.dll", "RtlDecodePointer"));

  // F0 0F AB 48 : lea rcx
  PLDRP_VECTOR_HANDLER_LIST vector_list = (PLDRP_VECTOR_HANDLER_LIST)((__int64)GetModuleHandleA("ntdll.dll") + 0x17F3E8);
  LIST_ENTRY* list_head = &vector_list->LdrpVehList;

  // this will be the function passed into SetUnhandledExceptionFilter
  log("UnhandledExceptionFilter: 0x%p\n", rtl_decode_pointer(*(__int64*)exception_filter));

  // dump out the vectored handler list
  for (LIST_ENTRY* list_entry = list_head->Flink; list_entry != list_head; list_entry = list_entry->Flink)
  {
  	PVECTOR_HANDLER_ENTRY pEntry = CONTAINING_RECORD(list_entry, VECTOR_HANDLER_ENTRY, ListEntry);
  	__int64 pExceptionHandler = rtl_decode_pointer((__int64)pEntry->EncodedHandler);
  	TCHAR modname[MAX_PATH];
  	GetModuleBaseNameW(GetCurrentProcess(), GetModuleHandle(NULL), modname, MAX_PATH);
  	log("VEH: 0x%p (%ws) [0x%p]\n", pExceptionHandler, modname, pExceptionHandler - (__int64)GetModuleHandleW(modname));
  }

  // dump out the continued handler list
  list_head = &vector_list->LdrpVchList;
  for (LIST_ENTRY* list_entry = list_head->Flink; list_entry != list_head; list_entry = list_entry->Flink)
  {
  	PVECTOR_HANDLER_ENTRY pEntry = CONTAINING_RECORD(list_entry, VECTOR_HANDLER_ENTRY, ListEntry);
  	__int64 pExceptionHandler = rtl_decode_pointer((__int64)pEntry->EncodedHandler);
  	TCHAR modname[MAX_PATH];
  	GetModuleBaseNameW(GetCurrentProcess(), GetModuleHandle(NULL), modname, MAX_PATH);
  	log("VCH: 0x%p (%ws) [0x%p]\n", pExceptionHandler, modname, pExceptionHandler - (__int64)GetModuleHandleW(modname));
  }
}
Mystery Tech?
I’m not sure what this is, but it looks like something that would flag virtual machines or custom versions of Windows.
我不确定这是什么,但看起来像是用来标记虚拟机或自定义版本的 Windows 的东西。
void ac_check_allocation_grad(fn callback)
{
  SYSTEM_BASIC_INFORMATION sbi;
  NtQuerySystemInformation(0, &sbi, sizeof(sbi), nullptr);

  if (sbi.AllocationGranularity != 0x10000)
  {
    callback();
  }

}
Since TAC is so reliant on the linked module list, they have a check that prevents someone from setting it to an empty list. Setting this to an empty list will probably break the process anyway.
由于 TAC 高度依赖链接模块列表,因此有一个检查防止将其设置为空列表。即使将其设置为空列表,过程也可能 Anyway 会被破坏。
void ac_detect_invalidated_module_list(fn callback)
{
  const auto memory_module_list = &NtCurrentPeb()->Ldr->InMemoryOrderModuleList;
  if (memory_module_list->Flink == memory_module_list)
  {
    callback();
  }
}
The End
TAC is a pretty cool user-mode anti-cheat, with features such as runtime API lookups, detecting poorly made hooks by passing clever invalid parameters, external overlay detection, internal DirectX hook detection, checking APIs that it uses for hooks, checking for debuggers and debugging artifacts, AllocConsole detection, CreateRemoteThread detection, and the coolest of all, spoofed and encrypted syscall stubs. Arxan really helps out TAC; it has powerful obfuscation, anti-static analysis methods, and a couple of features that break IDA Pro, all while monitoring the executable for .text modifications. It even has its own anti-debug techniques built-in. Similar code from TAC is being used in modern Call of Duty games. Overall, this was a huge learning experience, and a great challenge, and pretty unreal to see all the things that caught me! I hope you found my research interesting. I’m still not 100% done reversing the anti-cheat, so you can expect to see new information posted here sometime in the future! 😃
TAC 是一个相当酷的用户模式反作弊软件,具有运行时 API 查找、通过传递巧妙的无效参数检测劣质钩子、外部叠加检测、内部 DirectX 钩子检测、检查它使用的钩子 API、检测调试器和调试残留物、检测 AllocConsole、检测 CreateRemoteThread 以及最酷的功能,即伪造和加密的系统调用 stub。Arxan 真的帮助了 TAC;它具有强大的混淆、反静态分析方法,并且有几个功能可以破解 IDA Pro,同时监控可执行文件的 .text 修改。它甚至内置了自己的反调试技术。TAC 中的类似代码被用于现代的《使命召唤》游戏中。总体来说,这是一个巨大的学习经历,也是一个很好的挑战,看到所有捕获的内容真是令人难以置信!希望你发现我的研究有趣。我还没有完全反汇编完反作弊软件,所以你可以期待将来在这里看到新的信息!😃
References 参考文献
- https://www.lodsb.com/ntsetinformationthread-disabling-threadhidefromdebugger [#1]
- https://github.com/ayoubfaouzi/al-khaser/blob/master/al-khaser/AntiDebug/NtSetInformationThread_ThreadHideFromDebugger.cpp [#2]
- https://www.unknowncheats.me/forum/c-and-c-/567151-vectored-exception-handlers-x64-windows.html [#3]
- https://momo5502.com/posts/2022-11-17-reverse-engineering-integrity-checks-in-black-ops-3/ [#4]

 浙公网安备 33010602011771号