
logstash解耦之redis消息队列
logstash解耦之redis消息队列
架构图如下:
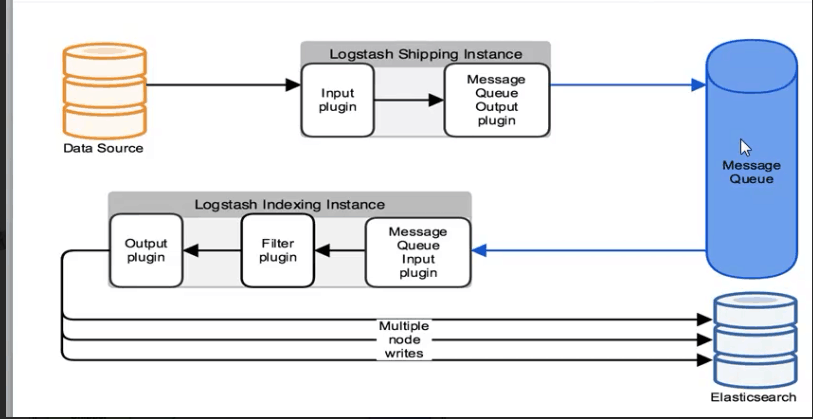
说明:通过input收集日志消息放入消息队列服务中(redis,MSMQ、Resque、ActiveMQ,RabbitMQ),再通过output取出消息写入ES上,kibana显示。
好处:松耦合,降低logstash收集日志的负载对业务服务不受影响,前后端分离,消息能存储不影响ES维护。
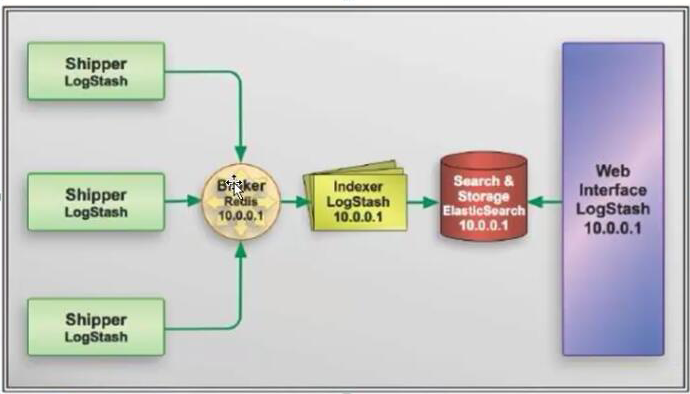
下面我们就用redis做消息队列存储,架构如下:
#安装redis,修改redis配置文件,bind和protected-mode
[root@elk-node1 conf.d]# yum install -y redis
[root@elk-node1 conf.d]# cp /etc/redis.conf{,.bak}
[root@elk-node1 conf.d]# grep "^[a-z]" /etc/redis.conf
bind 192.168.247.135
protected-mode yes
port 6379
tcp-backlog 511
timeout 0
tcp-keepalive 300
daemonize yes
supervised no
...
#启动redis服务
[root@elk-node1 conf.d]# systemctl start redis
You have new mail in /var/spool/mail/root
[root@elk-node1 conf.d]# ss -lntp|grep 6379
LISTEN     0      511    192.168.247.135:6379                     *:*                   users:(("redis-server",pid=18387,fd=4))
You have new mail in /var/spool/mail/root
[root@elk-node1 conf.d]# grep "^[a-z]" /etc/redis.conf^C
[root@elk-node1 conf.d]# redis-cli -h 192.168.247.135
192.168.247.135:6379> exit
#编写测试文件
[root@elk-node1 conf.d]# cat redis-out.conf
input{
    stdin{

}
}
output{
    redis{
    host => "192.168.247.135"
    port => "6379"
    db => "6"
    data_type => "list"
    key => "demo"
}
}
#logstash配置文件运行输入hello world
[root@elk-node1 conf.d]# /opt/logstash/bin/logstash -f /etc/logstash/conf.d/redis-out.conf
Settings: Default filter workers: 1
hello world
#另开一个窗口登录redis可以看到一条我们刚输入的hello world消息
[root@elk-node1 ~]# redis-cli -h 192.168.247.135
192.168.247.135:6379> info
Logstash startup completed
# Keyspace
db6:keys=1,expires=0,avg_ttl=0
192.168.247.135:6379> select 6
OK
192.168.247.135:6379[6]> key *
(error) ERR unknown command 'key'
192.168.247.135:6379[6]> keys *
1) "demo"
192.168.247.135:6379[6]> LINDEX demo -1
"{\"message\":\"hello world\",\"@version\":\"1\",\"@timestamp\":\"2018-07-28T06:44:50.418Z\",\"host\":\"elk-node1\"}"
192.168.247.135:6379[6]>
#接下来我们把消息写入ES,首先再输入多条消息
[root@elk-node1 conf.d]# /opt/logstash/bin/logstash -f /etc/logstash/conf.d/redis-out.conf
Settings: Default filter workers: 1
Logstash startup completed
fsadf
dgdf
gdg
ad
fd
ds
cd
g
rgergerg
rg
qrg
rh
rg
q
34tr
34
f
gdf
df

df
f
sdv
sdf

re
ter
t4
^CSIGINT received. Shutting down the pipeline. {:level=>:warn}

Logstash shutdown completed
#写一个输入到ES的配置文件
[root@elk-node1 conf.d]# cat redis-int.conf
input{
    redis{
        host => "192.168.247.135"
        port => "6379"
        db => "6"
        data_type => "list"
        key => "demo"
}
}
output{
        elasticsearch {
           hosts => ["192.168.247.135:9200"]
           index => "redis-demo-%{+YYYY.MM.dd}"
        }
    }
#logstash配置文件运行
[root@elk-node1 conf.d]# /opt/logstash/bin/logstash -f /etc/logstash/conf.d/redis-int.conf
Settings: Default filter workers: 1
Logstash startup completed
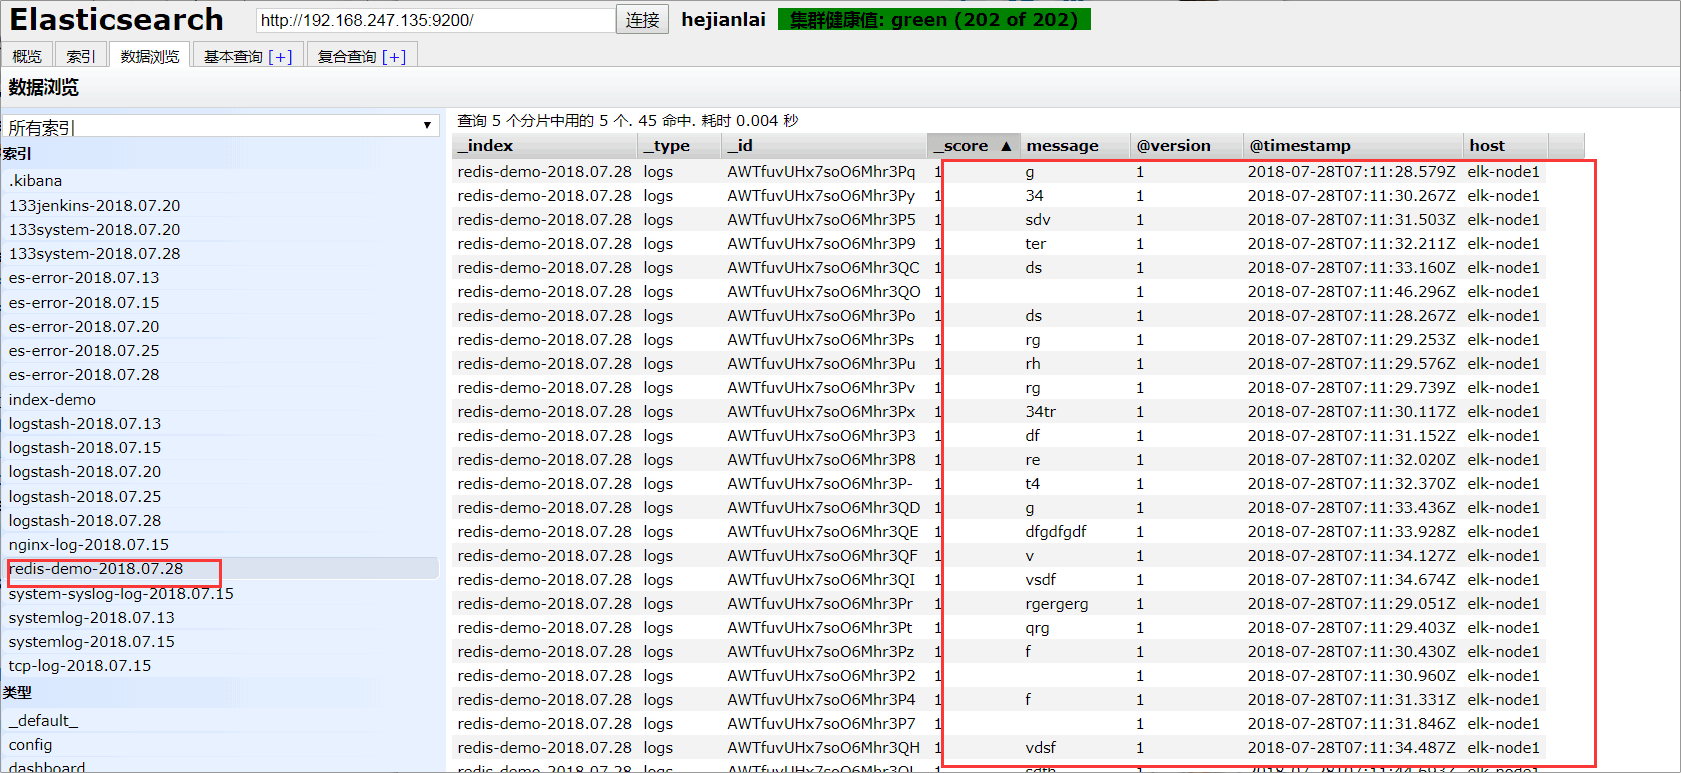
#这时我们看redis上的消息已经被消费了
192.168.247.135:6379[6]> LLEN demo
(integer) 0
我们在登录ES可以看到已经有记录了
#写一个系统监控的配置文件把日志写入redis,inpout里读取日志消息,output里写入redis。
[root@elk-node1 conf.d]# cat shipper.conf
input {
    file {
      path => "/var/log/messages"
      type => "system"
      start_position => "beginning"
    }
    file {
       path => "/var/log/elasticsearch/hejianlai.log"
       type => "es-error"
       start_position => "beginning"
	  codec => multiline {
          pattern => "^\["
          negate => true
          what => "previous"
        }
    }
       file {
       path => "/var/log/nginx/access_json.log"
       codec => json
       start_position => "beginning"
       type => "nginx-log"
    }
	syslog{
	type => "system-syslog"
	host => "192.168.247.135"
	port => "514"
}
}
output {

    if [type] == "system"{
	redis{
        host => "192.168.247.135"
        port => "6379"
        db => "6"
        data_type => "list"
        key => "system"
    }
}
    if [type] == "es-error"{
        redis{
        host => "192.168.247.135"
        port => "6379"
        db => "6"
        data_type => "list"
        key => "es-error"
    }
}
       if [type] == "nginx-log"{
        redis{
        host => "192.168.247.135"
        port => "6379"
        db => "6"
        data_type => "list"
        key => "nginx-log"
    }
}
       if [type] == "system-syslog"{
	redis{
        host => "192.168.247.135"
        port => "6379"
        db => "6"
        data_type => "list"
        key => "system-syslog"

    }
}
}
#运行配置文件
[root@elk-node1 conf.d]# /opt/logstash/bin/logstash -f /etc/logstash/conf.d/shipper.conf
#查看redis已经生成了相应的key
192.168.247.135:6379[6]> keys *
1) "system"
2) "nginx-log"
3) "es-error"
192.168.247.135:6379[6]>
#写一个配置文件从redis中把日志写入ES,inpout里读取redis消息,output里写入ES.
[root@elk-node2 conf.d]# cat display.conf
input {
	redis{
	type => "system-syslog"
        host => "192.168.247.135"
        port => "6379"
        db => "6"
        data_type => "list"
        key => "system-syslog"

    }
	redis{
      type => "system"
        host => "192.168.247.135"
        port => "6379"
        db => "6"
        data_type => "list"
        key => "system"

    }
	redis{
       type => "es-error"
        host => "192.168.247.135"
        port => "6379"
        db => "6"
        data_type => "list"
        key => "es-error"

    }
	redis{
       type => "nginx-log"
        host => "192.168.247.135"
        port => "6379"
        db => "6"
        data_type => "list"
        key => "nginx-log"

    }

}
output {

    if [type] == "system"{
        elasticsearch {
           hosts => ["192.168.247.135:9200"]
           index => "systemlog-%{+YYYY.MM.dd}"
        }
    }

    if [type] == "es-error"{
        elasticsearch {
           hosts => ["192.168.247.135:9200"]
           index => "es-error-%{+YYYY.MM.dd}"
        }
    }
       if [type] == "nginx-log"{
        elasticsearch {
           hosts => ["192.168.247.135:9200"]
           index => "nginx-log-%{+YYYY.MM.dd}"
        }
    }
       if [type] == "system-syslog"{
        elasticsearch {
           hosts => ["192.168.247.135:9200"]
           index => "system-syslog-log-%{+YYYY.MM.dd}"
        }
    }
}
#运行配置文件,就可以收集日志了。
[root@elk-node2 conf.d]# /opt/logstash/bin/logstash -f /etc/logstash/conf.d/display.conf &
到此logstash+redis+elasticsearch+kibana的架构搭建基本结束~~~~~
微信

支付宝


 浙公网安备 33010602011771号