
logstash收集TCP端口日志
logstash收集TCP端口日志
官方地址:https://www.elastic.co/guide/en/logstash-versioned-plugins/current/index.html
编写logstash文件
[root@elk-node1 conf.d]# cat tcp.conf
input{
    tcp{
    host => "192.168.247.135"
    port => "8888"
    }
}
output{
    stdout{
    codec => "rubydebug"
        }
}
#运行
[root@elk-node1 conf.d]# /opt/logstash/bin/logstash -f /etc/logstash/conf.d/tcp.conf
#另开一个窗口用nc的发请求
[root@elk-node1 ~]# yum install -y nc
[root@elk-node1 ~]# nc 192.168.247.135 8888 < /etc/passwd
[root@elk-node1 ~]# echo "hehehe" > /dev/tcp/192.168.247.135/8888
#在看第一个窗口就有数据了
[root@elk-node1 conf.d]# /opt/logstash/bin/logstash -f /etc/logstash/conf.d/tcp.conf
Settings: Default filter workers: 1
Logstash startup completed
{
       "message" => "root:x:0:0:root:/root:/bin/bash",
      "@version" => "1",
    "@timestamp" => "2018-07-15T10:54:41.404Z",
          "host" => "192.168.247.135",
          "port" => 54202
}
{
       "message" => "bin:x:1:1:bin:/bin:/sbin/nologin",
      "@version" => "1",
    "@timestamp" => "2018-07-15T10:54:41.407Z",
          "host" => "192.168.247.135",
          "port" => 54202
}
{
       "message" => "daemon:x:2:2:daemon:/sbin:/sbin/nologin",
      "@version" => "1",
    "@timestamp" => "2018-07-15T10:54:41.407Z",
          "host" => "192.168.247.135",
          "port" => 54202
}
{
       "message" => "adm:x:3:4:adm:/var/adm:/sbin/nologin",
      "@version" => "1",
    "@timestamp" => "2018-07-15T10:54:41.407Z",
          "host" => "192.168.247.135",
          "port" => 54202
}
{
       "message" => "hehehe",
      "@version" => "1",
    "@timestamp" => "2018-07-15T10:59:41.301Z",
          "host" => "192.168.247.135",
          "port" => 55156
}
#修改下写入es里
[root@elk-node1 conf.d]# cat tcp.conf
input{
    tcp{
    host => "192.168.247.135"
    port => "8888"
    type => "tcp"
    }
}
output{
    if [type] == "tcp"{
        elasticsearch {
           hosts => ["192.168.247.135:9200"]
           index => "tcp-log-%{+YYYY.MM.dd}"
        }
    }

}
[root@elk-node1 conf.d]# /opt/logstash/bin/logstash -f /etc/logstash/conf.d/tcp.conf --configtest
Configuration OK
#放入后台运行
[root@elk-node1 conf.d]# /opt/logstash/bin/logstash -f /etc/logstash/conf.d/tcp.conf &
#转点数据过去
[root@elk-node1 ~]# nc 192.168.247.135 8888 < /etc/passwd
Kibana配置
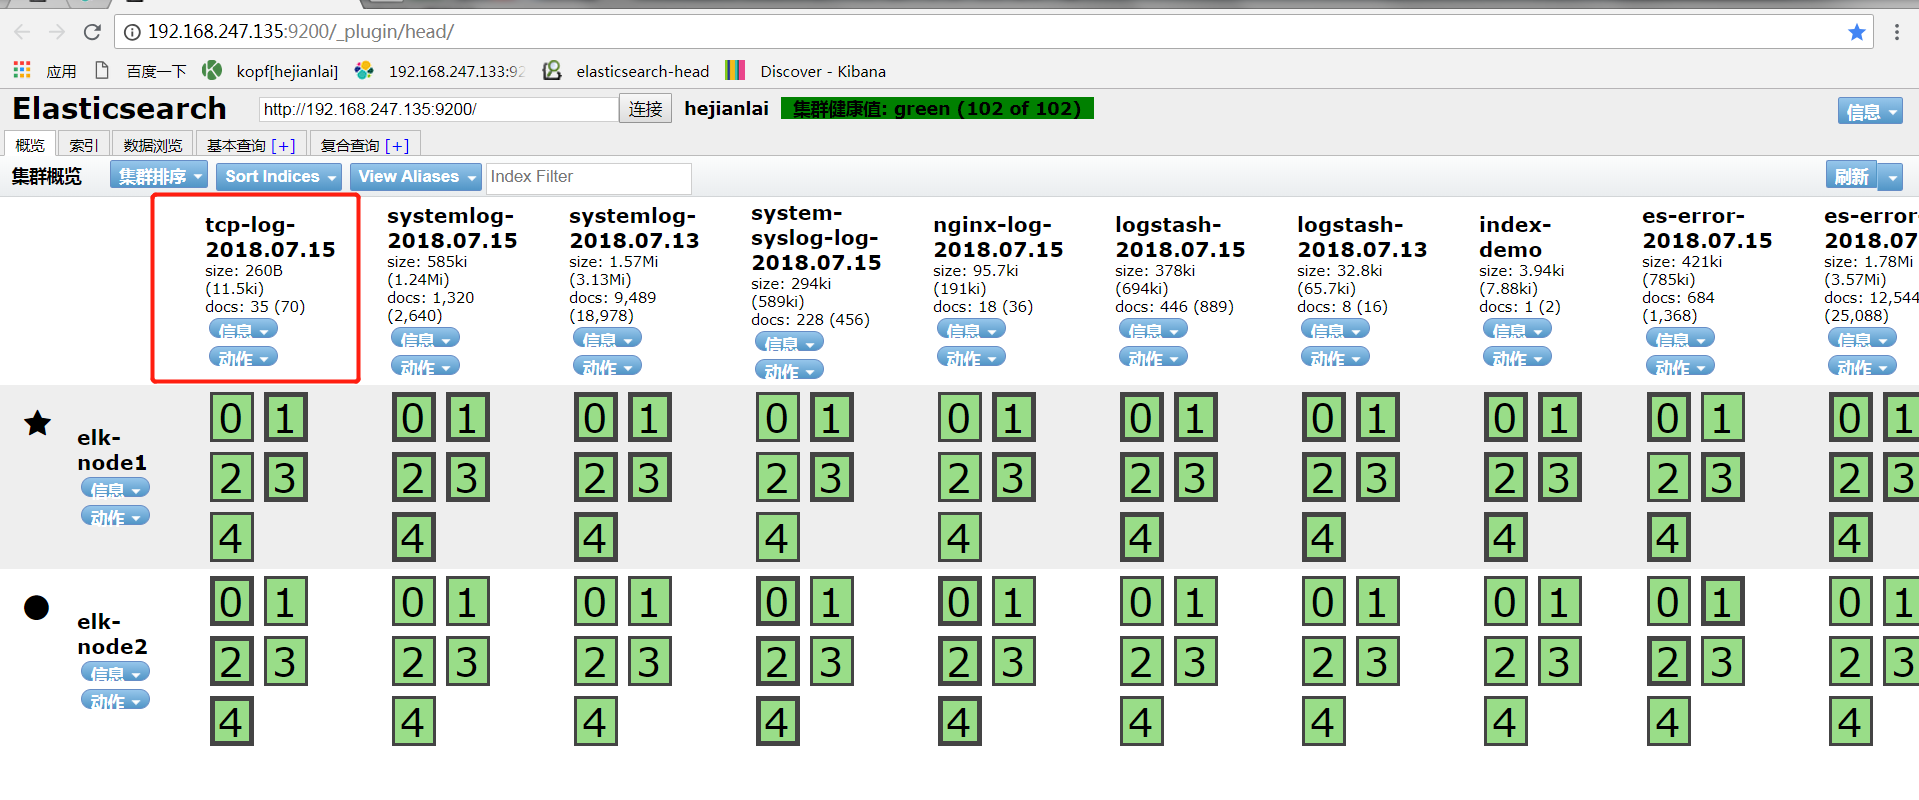
es的hand插件已经有了tcp-log的索引
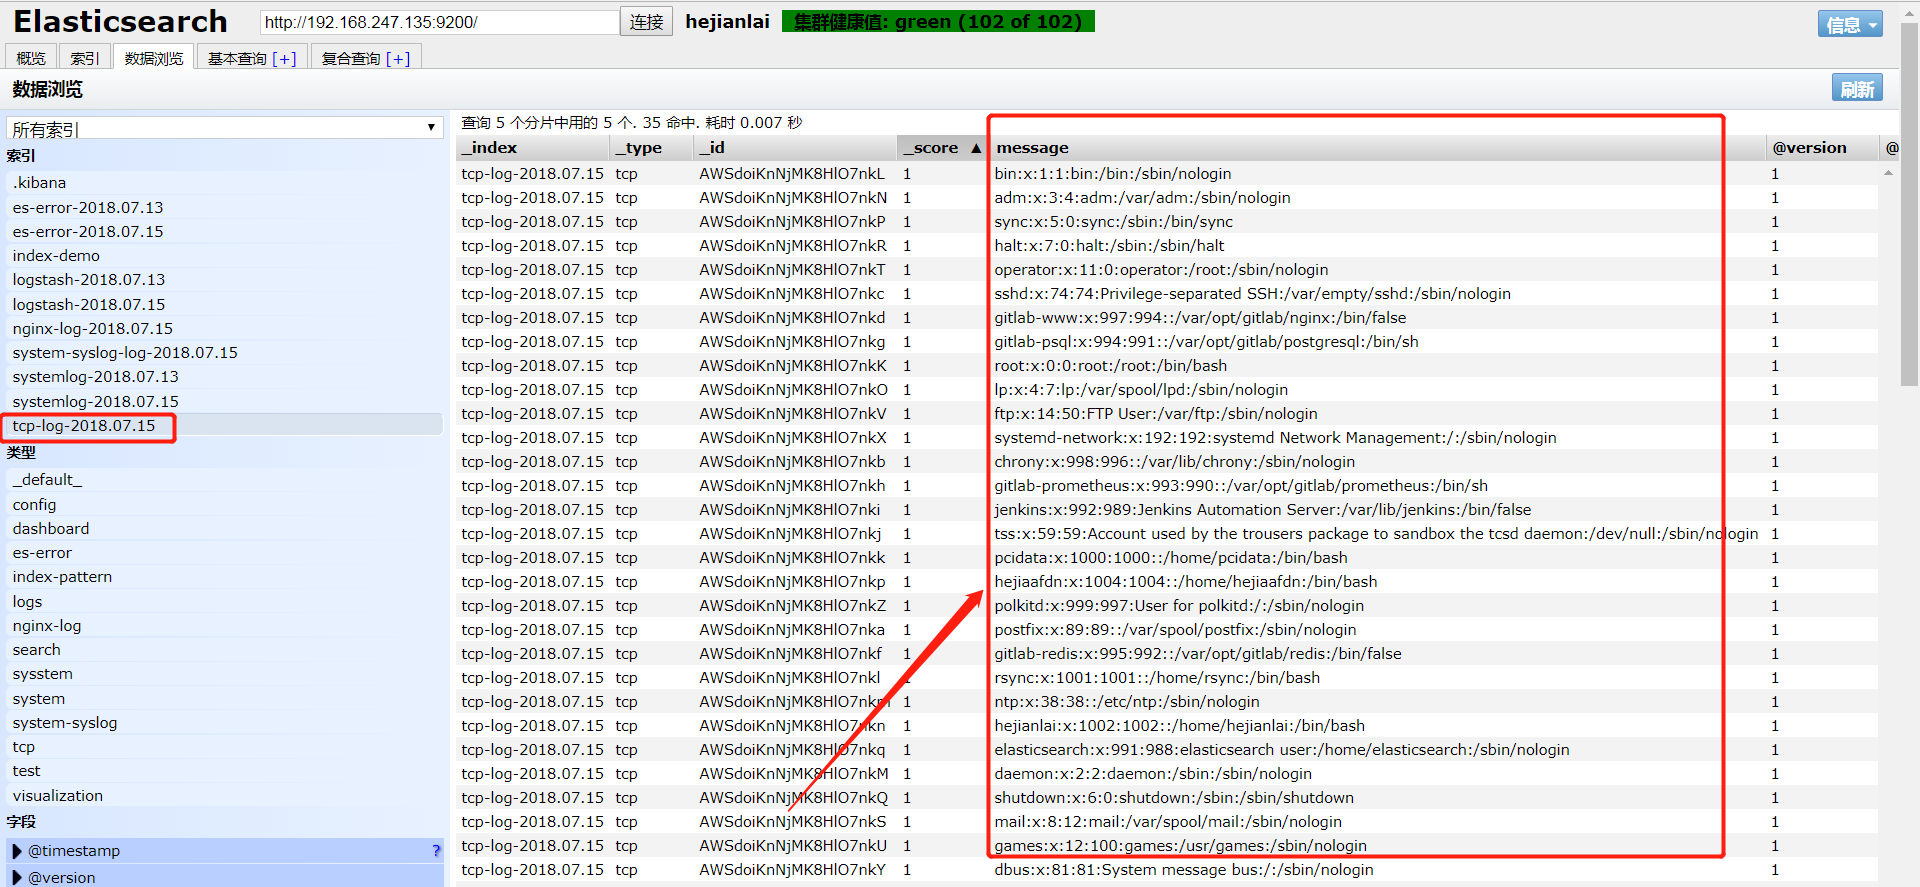
数据浏览
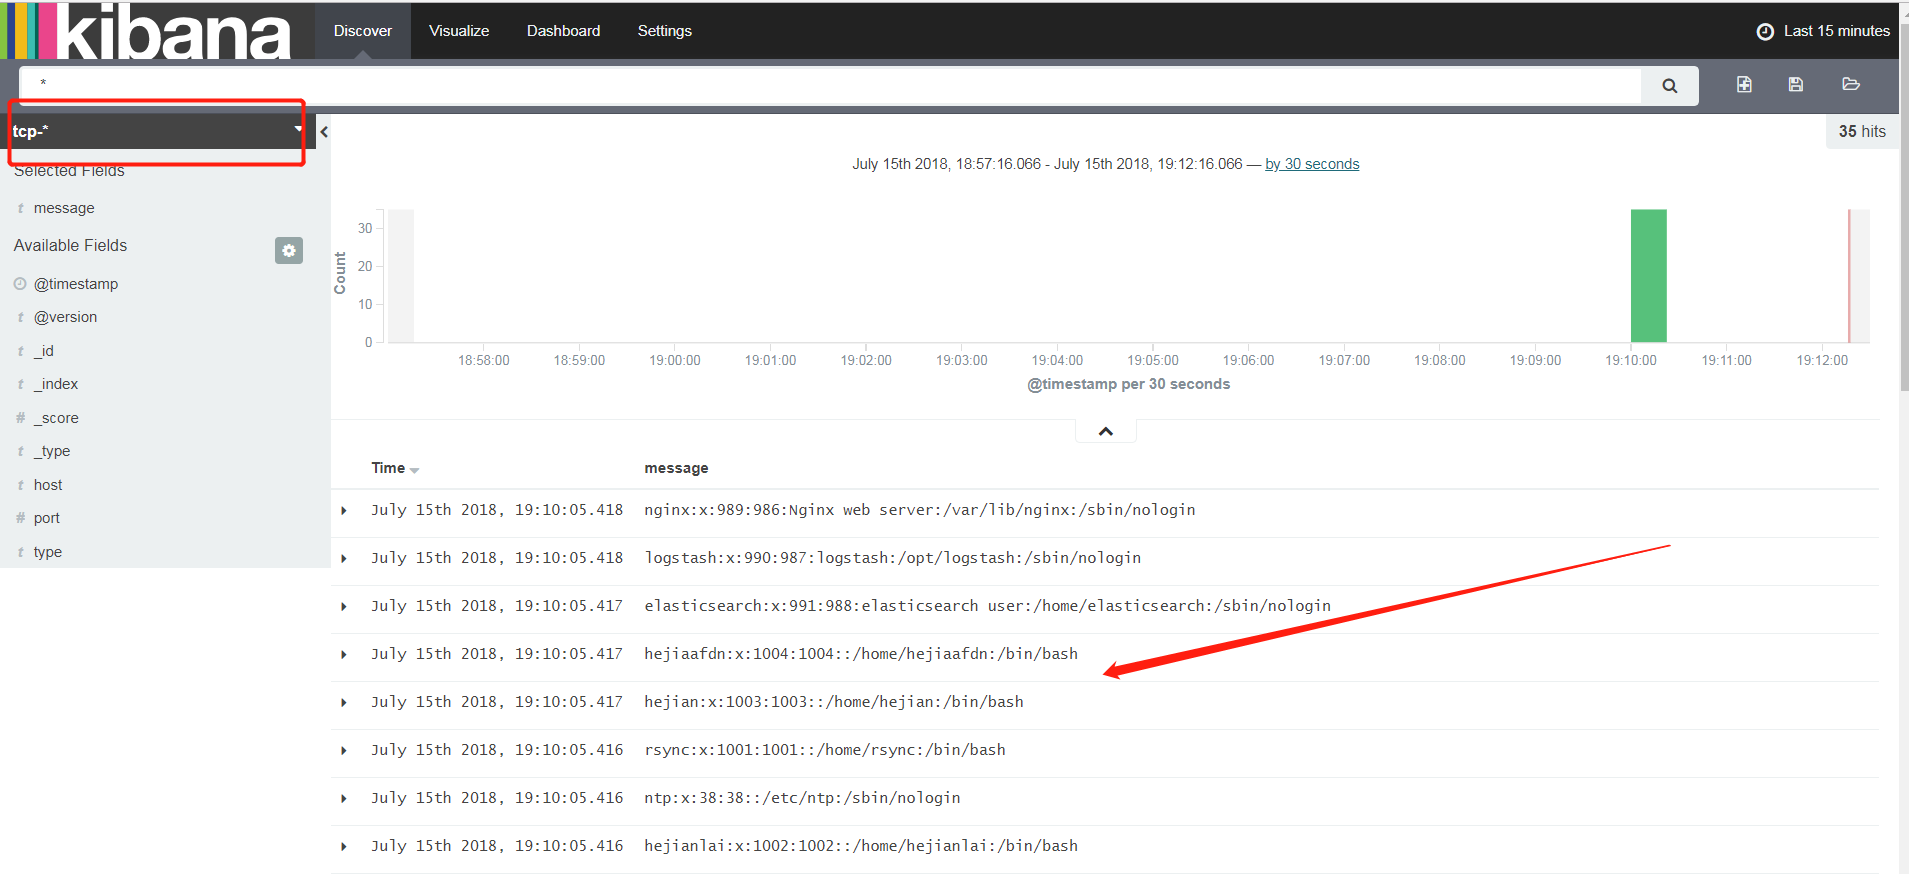
kibana添加tcp-log索引

如对您有帮助,支持下呗!
微信

支付宝


 浙公网安备 33010602011771号