
Prometheus Operator 监控Kubernetes
Prometheus Operator 监控Kubernetes
1. Prometheus的基本架构
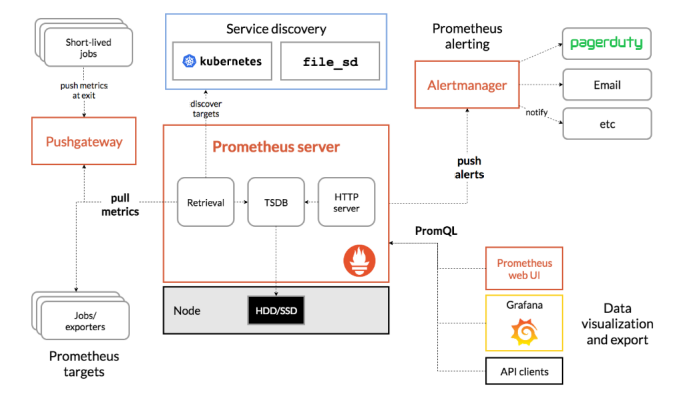
Prometheus是一个开源的完整监控解决方案,涵盖数据采集、查询、告警、展示整个监控流程,下图是Prometheus的架构图:
官方文档:https://prometheus.io/docs/introduction/overview/
2. 组件说明
Prometheus生态系统由多个组件组成。其中许多组件都是可选的
- Promethus server
必须安装,本质是一个时序数据库,主要负责数据pull、存储、分析,提供 PromQL 查询语言的支持;
- Push Gateway
非必选项,支持临时性Job主动推送指标的中间网关
- exporters
部署在客户端的agent,如 node_exporte, mysql_exporter等
提供被监控组件信息的 HTTP 接口被叫做 exporter ,目前互联网公司常用的组件大部分都有 exporter 可以直接使用,比如 Varnish、Haproxy、Nginx、MySQL、Linux 系统信息 (包括磁盘、内存、CPU、网络等等);如:https://prometheus.io/docs/instrumenting/exporters/
- alertmanager
用来进行报警,Promethus server 经过分析, 把出发的警报发送给 alertmanager 组件,alertmanager 组件通过自身的规则,来发送通知,(邮件,或者webhook)
3. Prometheus-Operator
Prometheus-Operator的架构图:
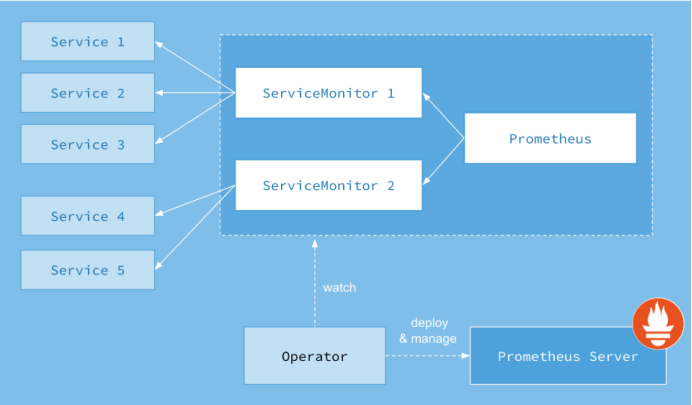
上图是Prometheus-Operator官方提供的架构图,其中Operator是最核心的部分,作为一个控制器,他会去创建Prometheus、ServiceMonitor、AlertManager以及PrometheusRule4个CRD资源对象,然后会一直监控并维持这4个资源对象的状态。
其中创建的prometheus这种资源对象就是作为Prometheus Server存在,而ServiceMonitor就是exporter的各种抽象,exporter前面我们已经学习了,是用来提供专门提供metrics数据接口的工具,Prometheus就是通过ServiceMonitor提供的metrics数据接口去 pull 数据的,当然alertmanager这种资源对象就是对应的AlertManager的抽象,而PrometheusRule是用来被Prometheus实例使用的报警规则文件。
这样我们要在集群中监控什么数据,就变成了直接去操作 Kubernetes 集群的资源对象了,是不是方便很多了。上图中的 Service 和 ServiceMonitor 都是 Kubernetes 的资源,一个 ServiceMonitor 可以通过 labelSelector 的方式去匹配一类 Service,Prometheus 也可以通过 labelSelector 去匹配多个ServiceMonitor。
4. Prometheus-Operator部署
官方chart地址:https://github.com/helm/charts/tree/master/stable/prometheus-operator
搜索最新包下载到本地
# 搜索
helm search prometheus-operator

NAME                            CHART VERSION   APP VERSION     DESCRIPTION
stable/prometheus-operator      6.4.0           0.31.0          Provides easy monitoring definitions for Kubernetes servi...
# 拉取到本地
helm fetch prometheus-operator
安装
# 新建一个monitoring的namespaces
Kubectl create ns monitoring
# 安装
helm install -f ./prometheus-operator/values.yaml --name prometheus-operator --namespace=monitoring ./prometheus-operator
# 更新
helm upgrade -f prometheus-operator/values.yaml prometheus-operator ./prometheus-operator
卸载prometheus-operator
helm delete prometheus-operator --purge
# 删除crd
kubectl delete customresourcedefinitions prometheuses.monitoring.coreos.com prometheusrules.monitoring.coreos.com servicemonitors.monitoring.coreos.com
kubectl delete customresourcedefinitions alertmanagers.monitoring.coreos.com
kubectl delete customresourcedefinitions podmonitors.monitoring.coreos.com
修改配置文档values.yaml
4.1. 邮件告警
  config:

    global:

      resolve_timeout: 5m

      smtp_smarthost: 'smtp.qq.com:465'

      smtp_from: '1xxx@qq.com'

      smtp_auth_username: '1xxx@qq.com'

      smtp_auth_password: 'xreqcqffrxtnieff'

      smtp_hello: '163.com'

      smtp_require_tls: false

    route:

      group_by: ['job','severity']

      group_wait: 30s

      group_interval: 1m

      repeat_interval: 12h

      receiver: default

      routes:

      - receiver: webhook

        match:

          alertname: TargetDown

    receivers:

    - name: default

      email_configs:

      - to: 'hejianlai@pcidata.cn'

        send_resolved: true

    - name: webhook

      email_configs:

      - to: 'xxx@xxx.cn'

        send_resolved: true
这里有个坑请参考:https://www.cnblogs.com/Dev0ps/p/11320177.html
4.2. prometheus持久化存储
  storage:

      volumeClaimTemplate:

        spec:

          storageClassName: nfs-client

          accessModes: ["ReadWriteOnce"]

          resources:

            requests:

              storage: 50Gi
4.3. Grafana持久化
路径:prometheus-operator/charts/grafana/values.yaml
persistence:

  enabled: true

  storageClassName: "nfs-client"

  accessModes:

    - ReadWriteOnce

  size: 10Gi
4.4. 自动发现Service
     - job_name: 'kubernetes-service-endpoints'

       kubernetes_sd_configs:

         - role: endpoints

       relabel_configs:

       - source_labels: [__meta_kubernetes_service_annotation_prometheus_io_scrape]

         action: keep

         regex: true

       - source_labels: [__meta_kubernetes_service_annotation_prometheus_io_scheme]

         action: replace

         target_label: __scheme__

         regex: (https?)

       - source_labels: [__meta_kubernetes_service_annotation_prometheus_io_path]

         action: replace

         target_label: __metrics_path__

         regex: (.+)

       - source_labels: [__address__, __meta_kubernetes_service_annotation_prometheus_io_port]

         action: replace

         target_label: __address__

         regex: ([^:]+)(?::\d+)?;(\d+)

         replacement: $1:$2

       - action: labelmap

         regex: __meta_kubernetes_service_label_(.+)

       - source_labels: [__meta_kubernetes_namespace]

         action: replace

         target_label: kubernetes_namespace

       - source_labels: [__meta_kubernetes_service_name]

         action: replace

         target_label: kubernetes_name

     - job_name: 'kubernetes-pod'

       kubernetes_sd_configs:

         - role: pod

       relabel_configs:

       - source_labels: [__meta_kubernetes_pod_annotation_prometheus_io_scrape]

         action: keep

         regex: true

       - source_labels: [__meta_kubernetes_pod_annotation_prometheus_io_path]

         action: replace

         target_label: __metrics_path__

         regex: (.+)

       - source_labels: [__address__, __meta_kubernetes_pod_annotation_prometheus_io_port]

         action: replace

         regex: ([^:]+)(?::\d+)?;(\d+)

         replacement: $1:$2

         target_label: __address__

       - action: labelmap

         regex: __meta_kubernetes_pod_label_(.+)

       - source_labels: [__meta_kubernetes_namespace]

         action: replace

         target_label: kubernetes_namespace

       - source_labels: [__meta_kubernetes_pod_name]

         action: replace

         target_label: kubernetes_pod_name

     - job_name: istio-mesh

       scrape_interval: 15s

       scrape_timeout: 10s

       metrics_path: /metrics

       scheme: http

       kubernetes_sd_configs:

       - api_server: null

         role: endpoints

         namespaces:

           names:

           - istio-system

       relabel_configs:

       - source_labels: [__meta_kubernetes_service_name, __meta_kubernetes_endpoint_port_name]

         separator: ;

         regex: istio-telemetry;prometheus

         replacement: $1

         action: keep

     - job_name: envoy-stats

       scrape_interval: 15s

       scrape_timeout: 10s

       metrics_path: /stats/prometheus

       scheme: http

       kubernetes_sd_configs:

       - api_server: null

         role: pod

         namespaces:

           names: []

       relabel_configs:

       - source_labels: [__meta_kubernetes_pod_container_port_name]

         separator: ;

         regex: .*-envoy-prom

         replacement: $1

         action: keep

       - source_labels: [__address__, __meta_kubernetes_pod_annotation_prometheus_io_port]

         separator: ;

         regex: ([^:]+)(?::\d+)?;(\d+)

         target_label: __address__

         replacement: $1:15090

         action: replace

       - separator: ;

         regex: __meta_kubernetes_pod_label_(.+)

         replacement: $1

         action: labelmap

       - source_labels: [__meta_kubernetes_namespace]

         separator: ;

         regex: (.*)

         target_label: namespace

         replacement: $1

         action: replace

       - source_labels: [__meta_kubernetes_pod_name]

         separator: ;

         regex: (.*)

         target_label: pod_name

         replacement: $1

         action: replace

       metric_relabel_configs:

       - source_labels: [cluster_name]

         separator: ;

         regex: (outbound|inbound|prometheus_stats).*

         replacement: $1

         action: drop

       - source_labels: [tcp_prefix]

         separator: ;

         regex: (outbound|inbound|prometheus_stats).*

         replacement: $1

         action: drop

       - source_labels: [listener_address]

         separator: ;

         regex: (.+)

         replacement: $1

         action: drop

       - source_labels: [http_conn_manager_listener_prefix]

         separator: ;

         regex: (.+)

         replacement: $1

         action: drop

       - source_labels: [http_conn_manager_prefix]

         separator: ;

         regex: (.+)

         replacement: $1

         action: drop

       - source_labels: [__name__]

         separator: ;

         regex: envoy_tls.*

         replacement: $1

         action: drop

       - source_labels: [__name__]

         separator: ;

         regex: envoy_tcp_downstream.*

         replacement: $1

         action: drop

       - source_labels: [__name__]

         separator: ;

         regex: envoy_http_(stats|admin).*

         replacement: $1

         action: drop

       - source_labels: [__name__]

         separator: ;

         regex: envoy_cluster_(lb|retry|bind|internal|max|original).*

         replacement: $1

         action: drop

     - job_name: istio-policy

       scrape_interval: 15s

       scrape_timeout: 10s

       metrics_path: /metrics

       scheme: http

       kubernetes_sd_configs:

       - api_server: null

         role: endpoints

         namespaces:

           names:

           - istio-system

       relabel_configs:

       - source_labels: [__meta_kubernetes_service_name, __meta_kubernetes_endpoint_port_name]

         separator: ;

         regex: istio-policy;http-monitoring

         replacement: $1

         action: keep

     - job_name: istio-telemetry

       scrape_interval: 15s

       scrape_timeout: 10s

       metrics_path: /metrics

       scheme: http

       kubernetes_sd_configs:

       - api_server: null

         role: endpoints

         namespaces:

           names:

           - istio-system

       relabel_configs:

       - source_labels: [__meta_kubernetes_service_name, __meta_kubernetes_endpoint_port_name]

         separator: ;

         regex: istio-telemetry;http-monitoring

         replacement: $1

         action: keep

     - job_name: pilot

       scrape_interval: 15s

       scrape_timeout: 10s

       metrics_path: /metrics

       scheme: http

       kubernetes_sd_configs:

       - api_server: null

         role: endpoints

         namespaces:

           names:

           - istio-system

       relabel_configs:

       - source_labels: [__meta_kubernetes_service_name, __meta_kubernetes_endpoint_port_name]

         separator: ;

         regex: istio-pilot;http-monitoring

         replacement: $1

         action: keep

     - job_name: galley

       scrape_interval: 15s

       scrape_timeout: 10s

       metrics_path: /metrics

       scheme: http

       kubernetes_sd_configs:

       - api_server: null

         role: endpoints

         namespaces:

           names:

           - istio-system

       relabel_configs:

       - source_labels: [__meta_kubernetes_service_name, __meta_kubernetes_endpoint_port_name]

         separator: ;

         regex: istio-galley;http-monitoring

         replacement: $1

         action: keep

     - job_name: citadel

       scrape_interval: 15s

       scrape_timeout: 10s

       metrics_path: /metrics

       scheme: http

       kubernetes_sd_configs:

       - api_server: null

         role: endpoints

         namespaces:

           names:

           - istio-system

       relabel_configs:

       - source_labels: [__meta_kubernetes_service_name, __meta_kubernetes_endpoint_port_name]

         separator: ;

         regex: istio-citadel;http-monitoring

         replacement: $1

         action: keep

     - job_name: kubernetes-pods-istio-secure

       scrape_interval: 15s

       scrape_timeout: 10s

       metrics_path: /metrics

       scheme: https

       kubernetes_sd_configs:

       - api_server: null

         role: pod

         namespaces:

           names: []

       tls_config:

         ca_file: /etc/istio-certs/root-cert.pem

         cert_file: /etc/istio-certs/cert-chain.pem

         key_file: /etc/istio-certs/key.pem

         insecure_skip_verify: true

       relabel_configs:

       - source_labels: [__meta_kubernetes_pod_annotation_prometheus_io_scrape]

         separator: ;

         regex: "true"

         replacement: $1

         action: keep

       - source_labels: [__meta_kubernetes_pod_annotation_sidecar_istio_io_status, __meta_kubernetes_pod_annotation_istio_mtls]

         separator: ;

         regex: (([^;]+);([^;]*))|(([^;]*);(true))

         replacement: $1

         action: keep

       - source_labels: [__meta_kubernetes_pod_annotation_prometheus_io_scheme]

         separator: ;

         regex: (http)

         replacement: $1

         action: drop

       - source_labels: [__meta_kubernetes_pod_annotation_prometheus_io_path]

         separator: ;

         regex: (.+)

         target_label: __metrics_path__

         replacement: $1

         action: replace

       - source_labels: [__address__]

         separator: ;

         regex: ([^:]+):(\d+)

         replacement: $1

         action: keep

       - source_labels: [__address__, __meta_kubernetes_pod_annotation_prometheus_io_port]

         separator: ;

         regex: ([^:]+)(?::\d+)?;(\d+)

         target_label: __address__

         replacement: $1:$2

         action: replace

       - separator: ;

         regex: __meta_kubernetes_pod_label_(.+)

         replacement: $1

         action: labelmap

       - source_labels: [__meta_kubernetes_namespace]

         separator: ;

         regex: (.*)

         target_label: namespace

         replacement: $1

         action: replace

       - source_labels: [__meta_kubernetes_pod_name]

         separator: ;

         regex: (.*)

         target_label: pod_name

         replacement: $1

         action: replace
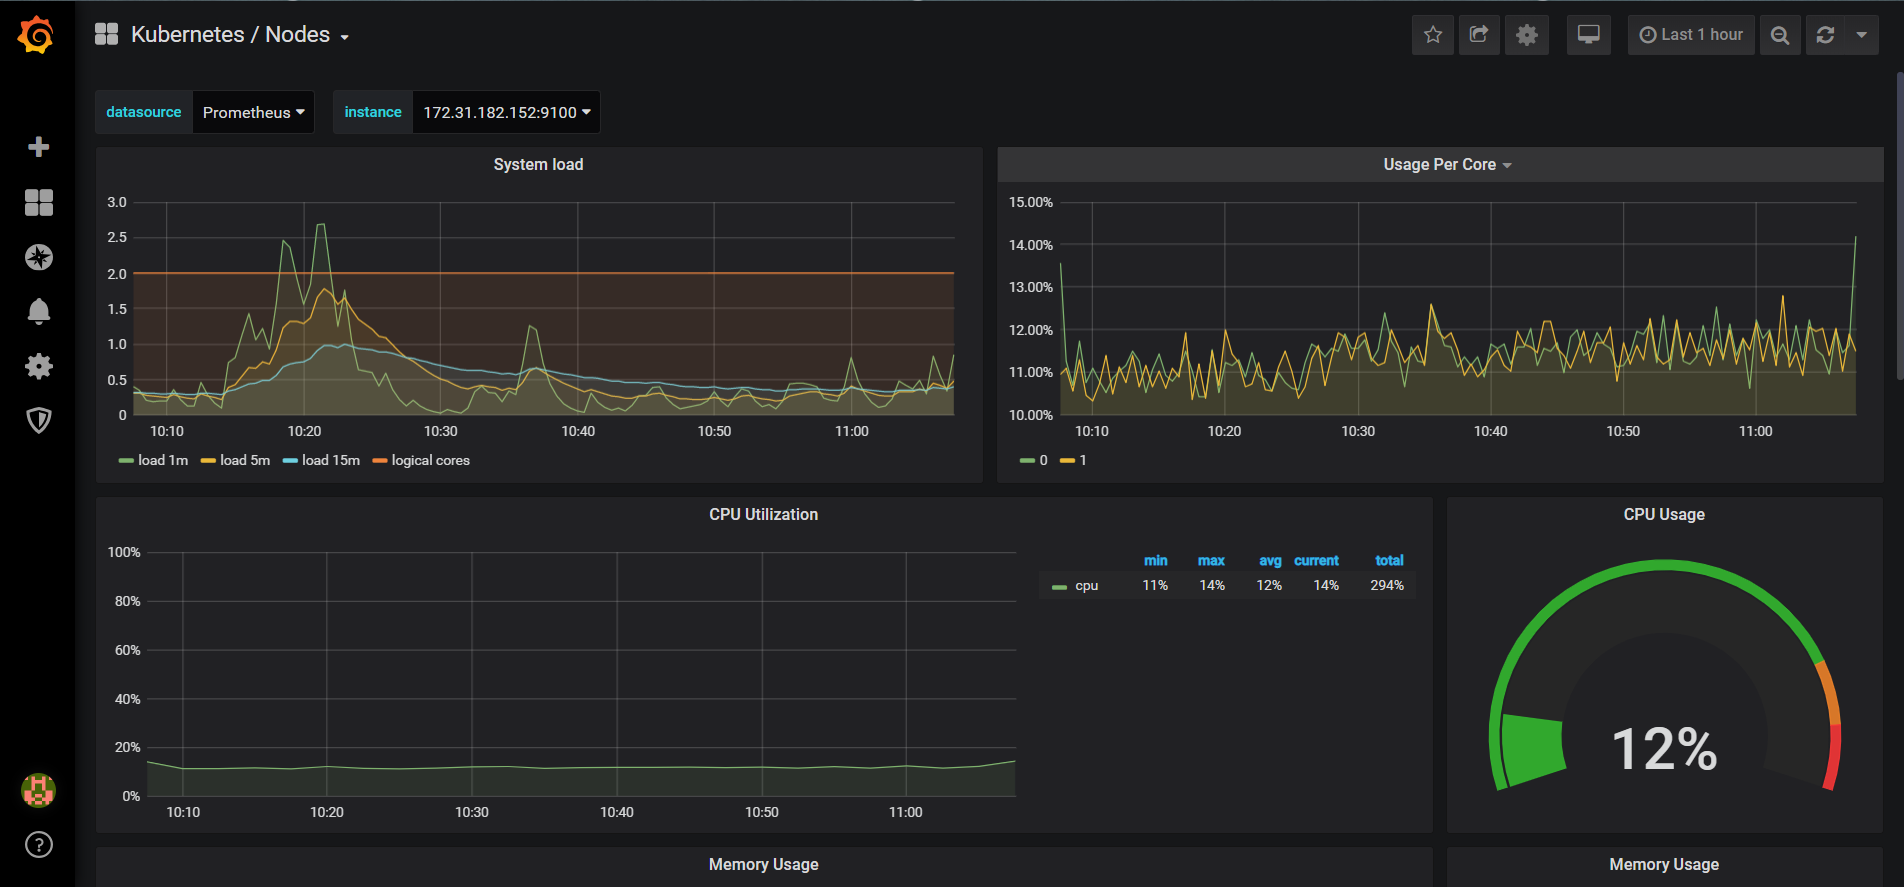
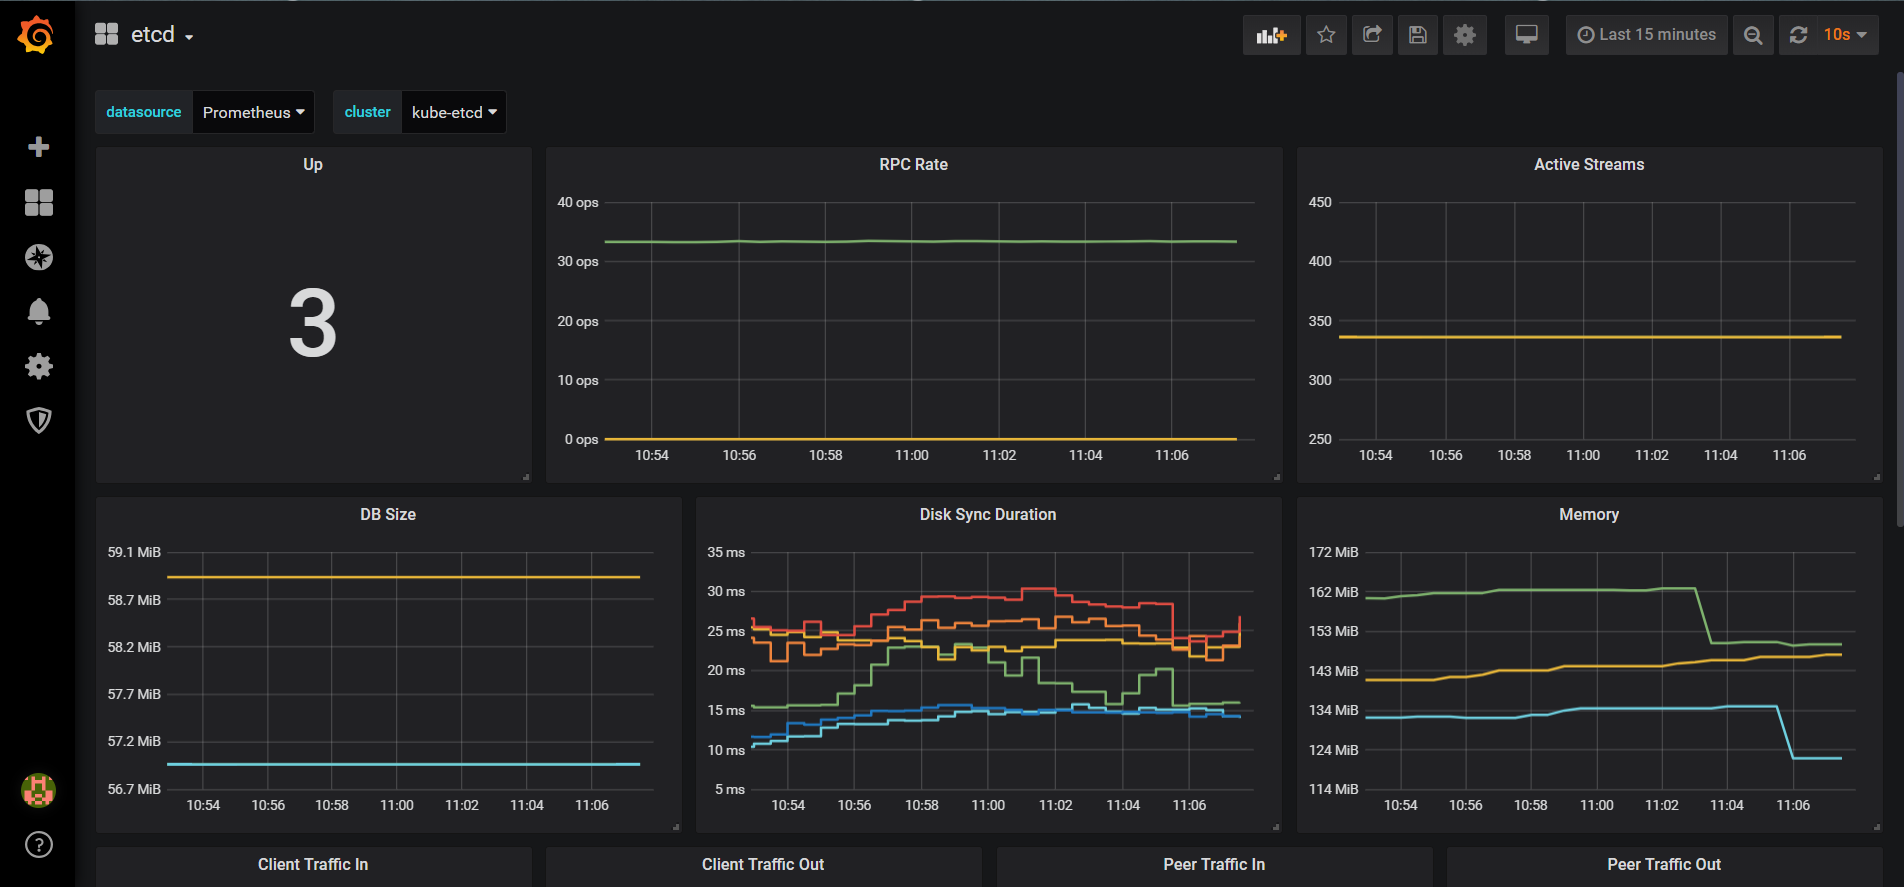
4.5. etcd
对于 etcd 集群一般情况下,为了安全都会开启 https 证书认证的方式,所以要想让 Prometheus 访问到 etcd 集群的监控数据,就需要提供相应的证书校验。
由于我们这里演示环境使用的是 Kubeadm 搭建的集群,我们可以使用 kubectl 工具去获取 etcd 启动的时候使用的证书路径:
[root@cn-hongkong ~]# kubectl get pod etcd-cn-hongkong.i-j6caps6av1mtyxyofmrw -n kube-system -o yaml
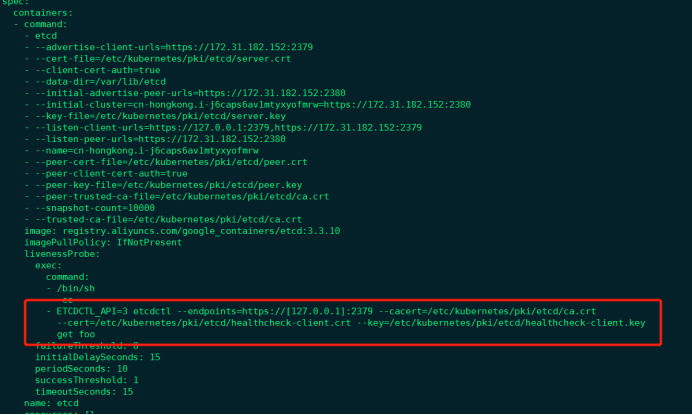
我们可以看到 etcd 使用的证书都对应在节点的 /etc/kubernetes/pki/etcd 这个路径下面,所以首先我们将需要使用到的证书通过 secret 对象保存到集群中去:(在 etcd 运行的节点)
1) 手动获取etcd信息
curl --cacert /etc/kubernetes/pki/etcd/ca.crt --cert /etc/kubernetes/pki/etcd/healthcheck-client.crt --key /etc/kubernetes/pki/etcd/healthcheck-client.key https://172.31.182.152:2379/metrics
2) 使用prometheus抓取
kubectl -n monitoring create secret generic etcd-certs --from-file=/etc/kubernetes/pki/etcd/healthcheck-client.crt --from-file=/etc/kubernetes/pki/etcd/healthcheck-client.key --from-file=/etc/kubernetes/pki/etcd/ca.crt
3) 添加values.yaml文件中kubeEtcd配置
## Component scraping etcd

##

kubeEtcd:

  enabled: true

  ## If your etcd is not deployed as a pod, specify IPs it can be found on

  ##

  endpoints: []

  ## Etcd service. If using kubeEtcd.endpoints only the port and targetPort are used

  ##

  service:

    port: 2379

    targetPort: 2379

    selector:

      component: etcd

  ## Configure secure access to the etcd cluster by loading a secret into prometheus and

  ## specifying security configuration below. For example, with a secret named etcd-client-cert

  ##

  serviceMonitor:

    scheme: https

    insecureSkipVerify: true

    serverName: localhost

    caFile: /etc/prometheus/secrets/etcd-certs/ca.crt

    certFile: /etc/prometheus/secrets/etcd-certs/healthcheck-client.crt

    keyFile: /etc/prometheus/secrets/etcd-certs/healthcheck-client.key
4) 将上面创建的etcd-certs对象配置到prometheus中(特别重要)
## Secrets is a list of Secrets in the same namespace as the Prometheus object, which shall be mounted into the Prometheus Pods.
## The Secrets are mounted into /etc/prometheus/secrets/. Secrets changes after initial creation of a Prometheus object are not
## reflected in the running Pods. To change the secrets mounted into the Prometheus Pods, the object must be deleted and recreated
## with the new list of secrets.
##
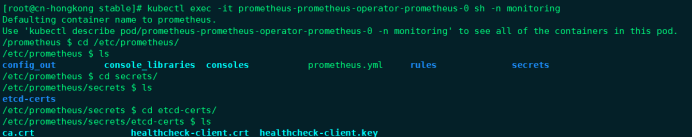
secrets:
- etcd-certs
安装后证书就会出现在prometheus目录下
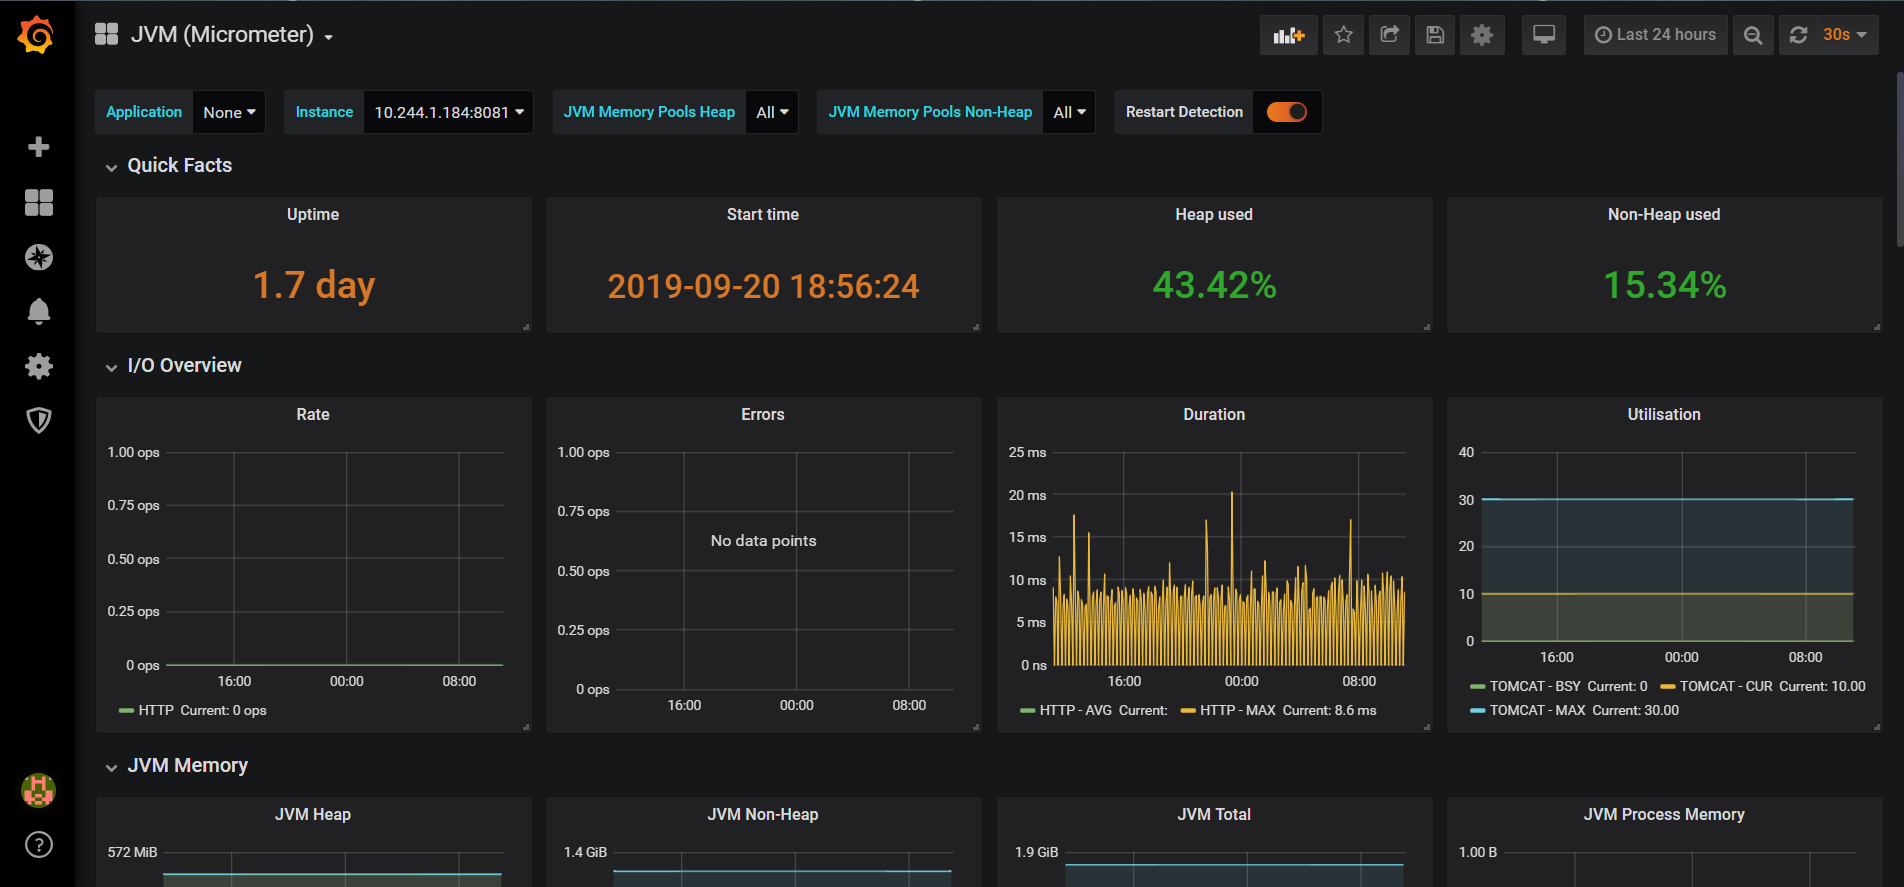
4.6抓取自定义Server
我们需要建一个ServiceMonitor,namespaceSelector:的any:true表示匹配 所有命名空间下面的具有 app= sscp-transaction这个 label 标签的 Service。
apiVersion: monitoring.coreos.com/v1
kind: ServiceMonitor
metadata:
  labels:
    app: sscp-transaction
    release: prometheus-operator
  name: springboot
  namespace: monitoring
spec:
  endpoints:
  - interval: 15s
    path: /actuator/prometheus
    port: health
    scheme: http
  namespaceSelector:
    any: true
#    matchNames:
#    - sscp-dev
  selector:
    matchLabels:
      app: sscp-transaction
#      release: sscp
效果图:
微信

支付宝


 浙公网安备 33010602011771号