结对第二次作业——某次疫情统计可视化的实现
结对第二次作业——某次疫情统计可视化的实现
| 这个作业属于哪个课程 | <2020春S班(福州大学)> |
|---|---|
| 这个作业要求在哪里 | <结对第二次作业——某次疫情统计可视化的实现> |
| 结对学号 | 221701411 221701433 |
| 这个作业的目标 | 疫情可视化实现 |
| 作业正文 | <结对第二次作业——某次疫情统计可视化的实现> |
| 其他参考文献 | echars |
仓库链接
<仓库链接>
代码规范
<代码规范>
成品展示

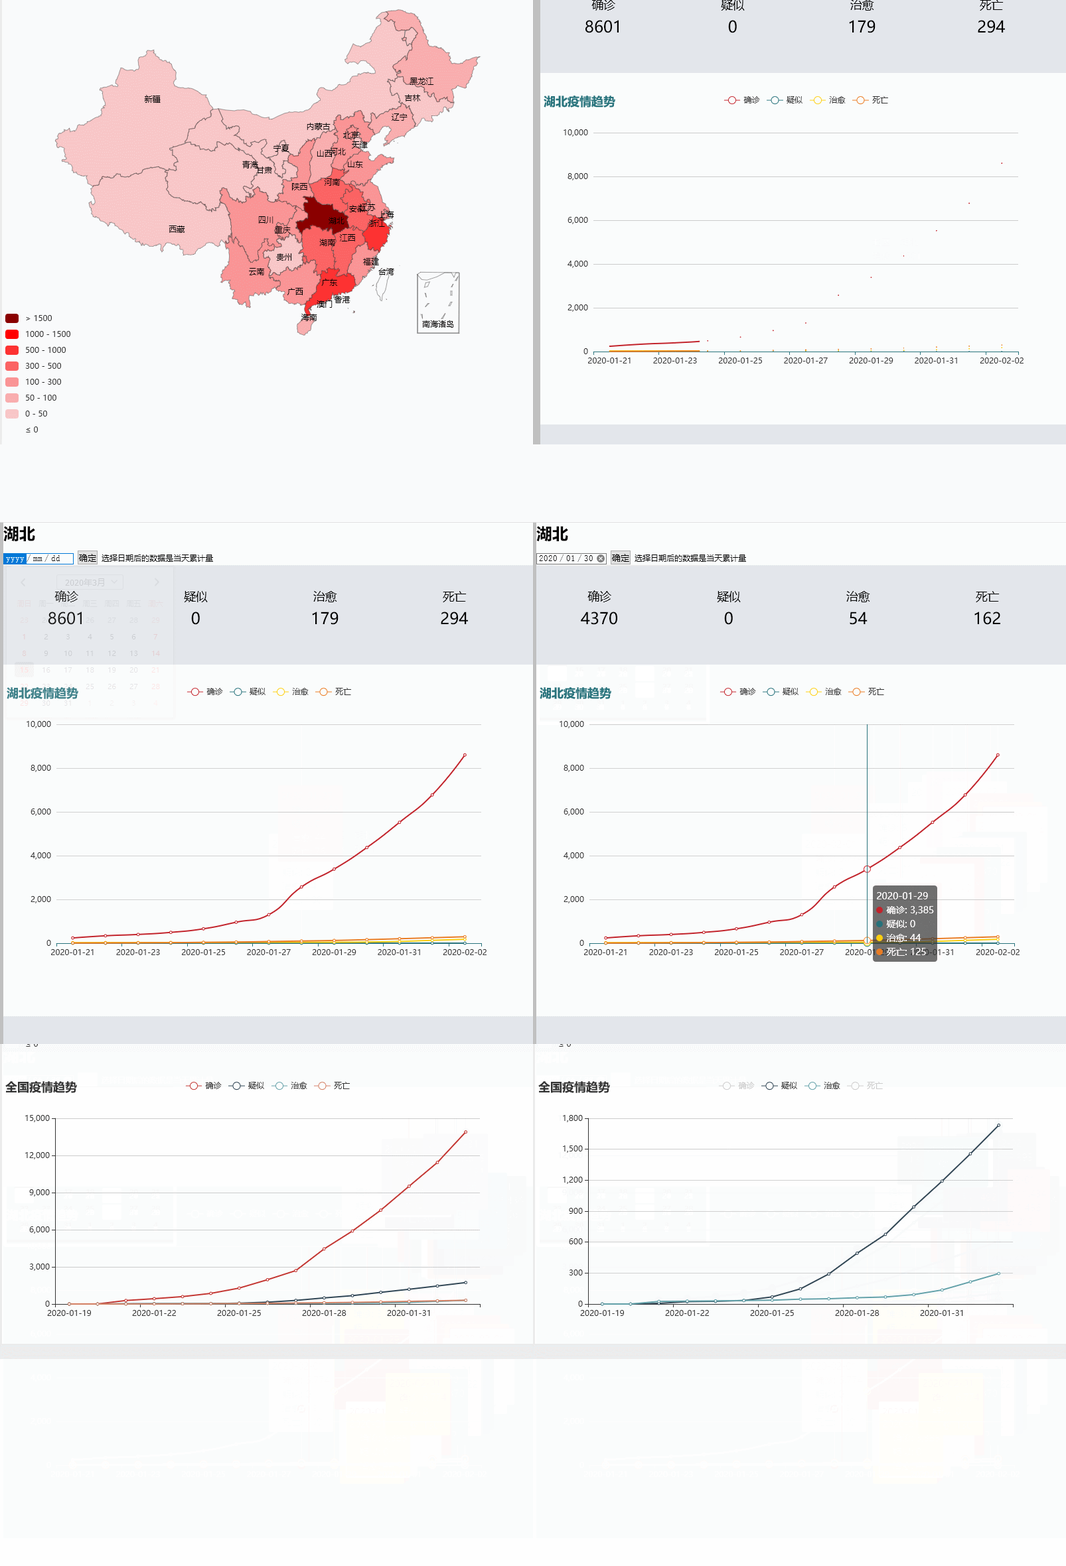
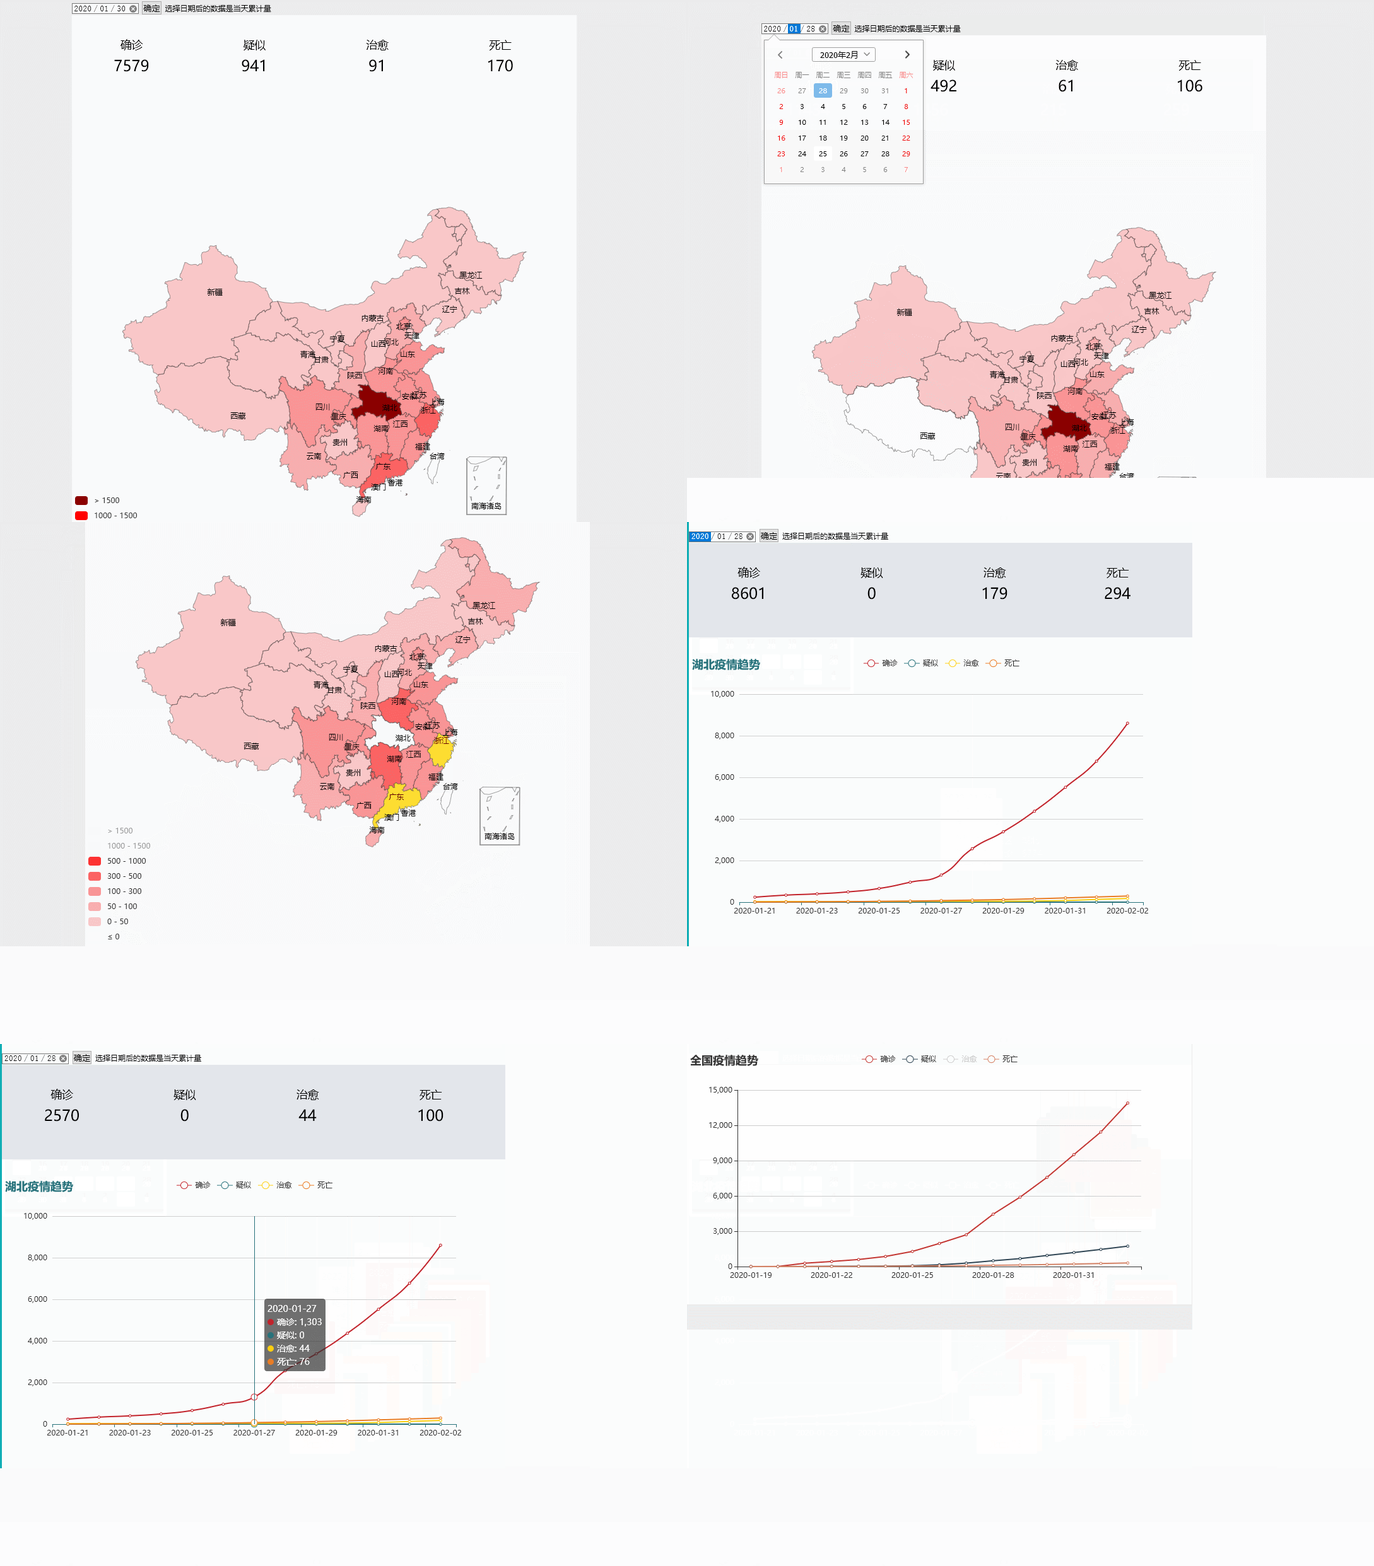
- 全国地图上使用不同的颜色代表大概确诊人数区间
颜色的深浅表示疫情的严重程度,可以直观了解高危区域;
鼠标移到每个省份会高亮显示;
点击鼠标会显示该省具体疫情情况;
点击鼠标可以查看各个日期的各省疫情状况
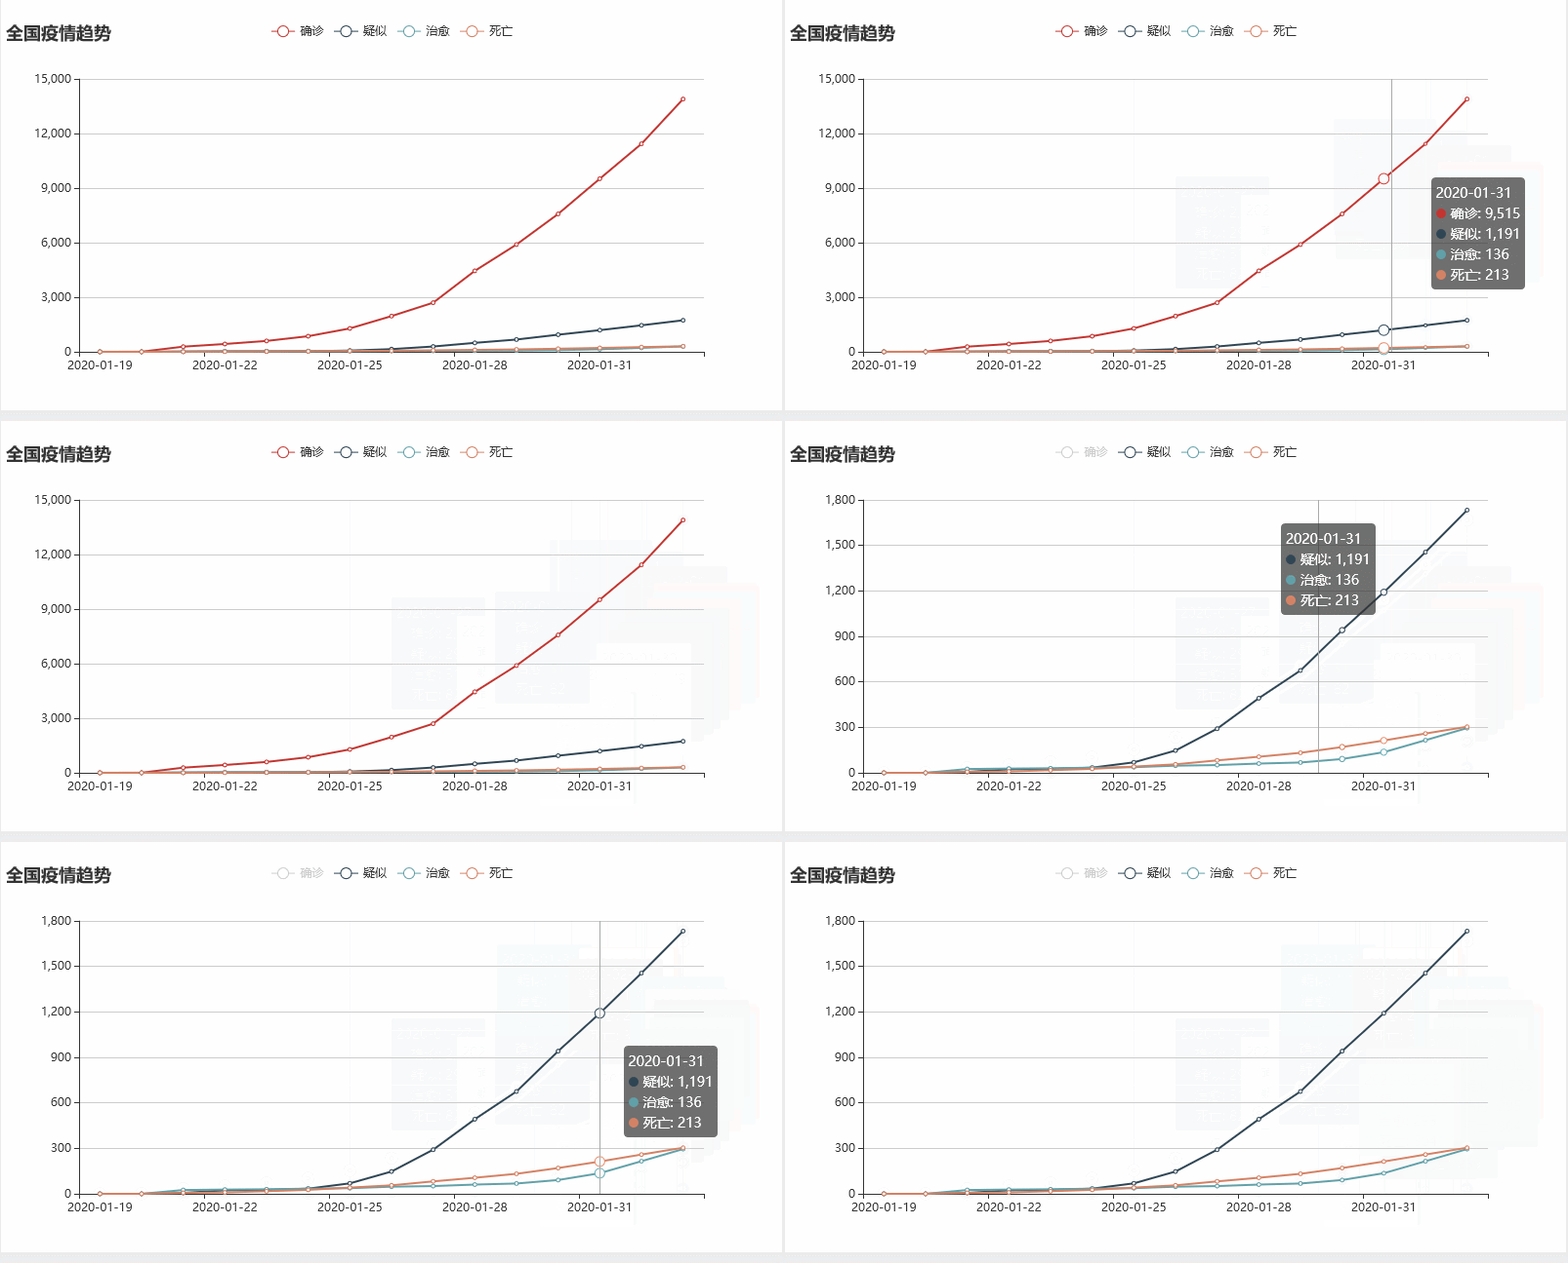
点击鼠标可以查看各个日期的全国疫情状况
结对过程
- 结对开始,制定计划,确定本次作业的牵头人

- 了解本次作业需要要到的技术,查找资料学习相关技术

- 爬虫相关知识没有学习过,我们先进行第一版本的开发,将爬虫作为第二版本

- 创建github仓库,组队开发

- 成品的git图片展示

- 归纳总结,以及最后的博客编写

设计实现过程
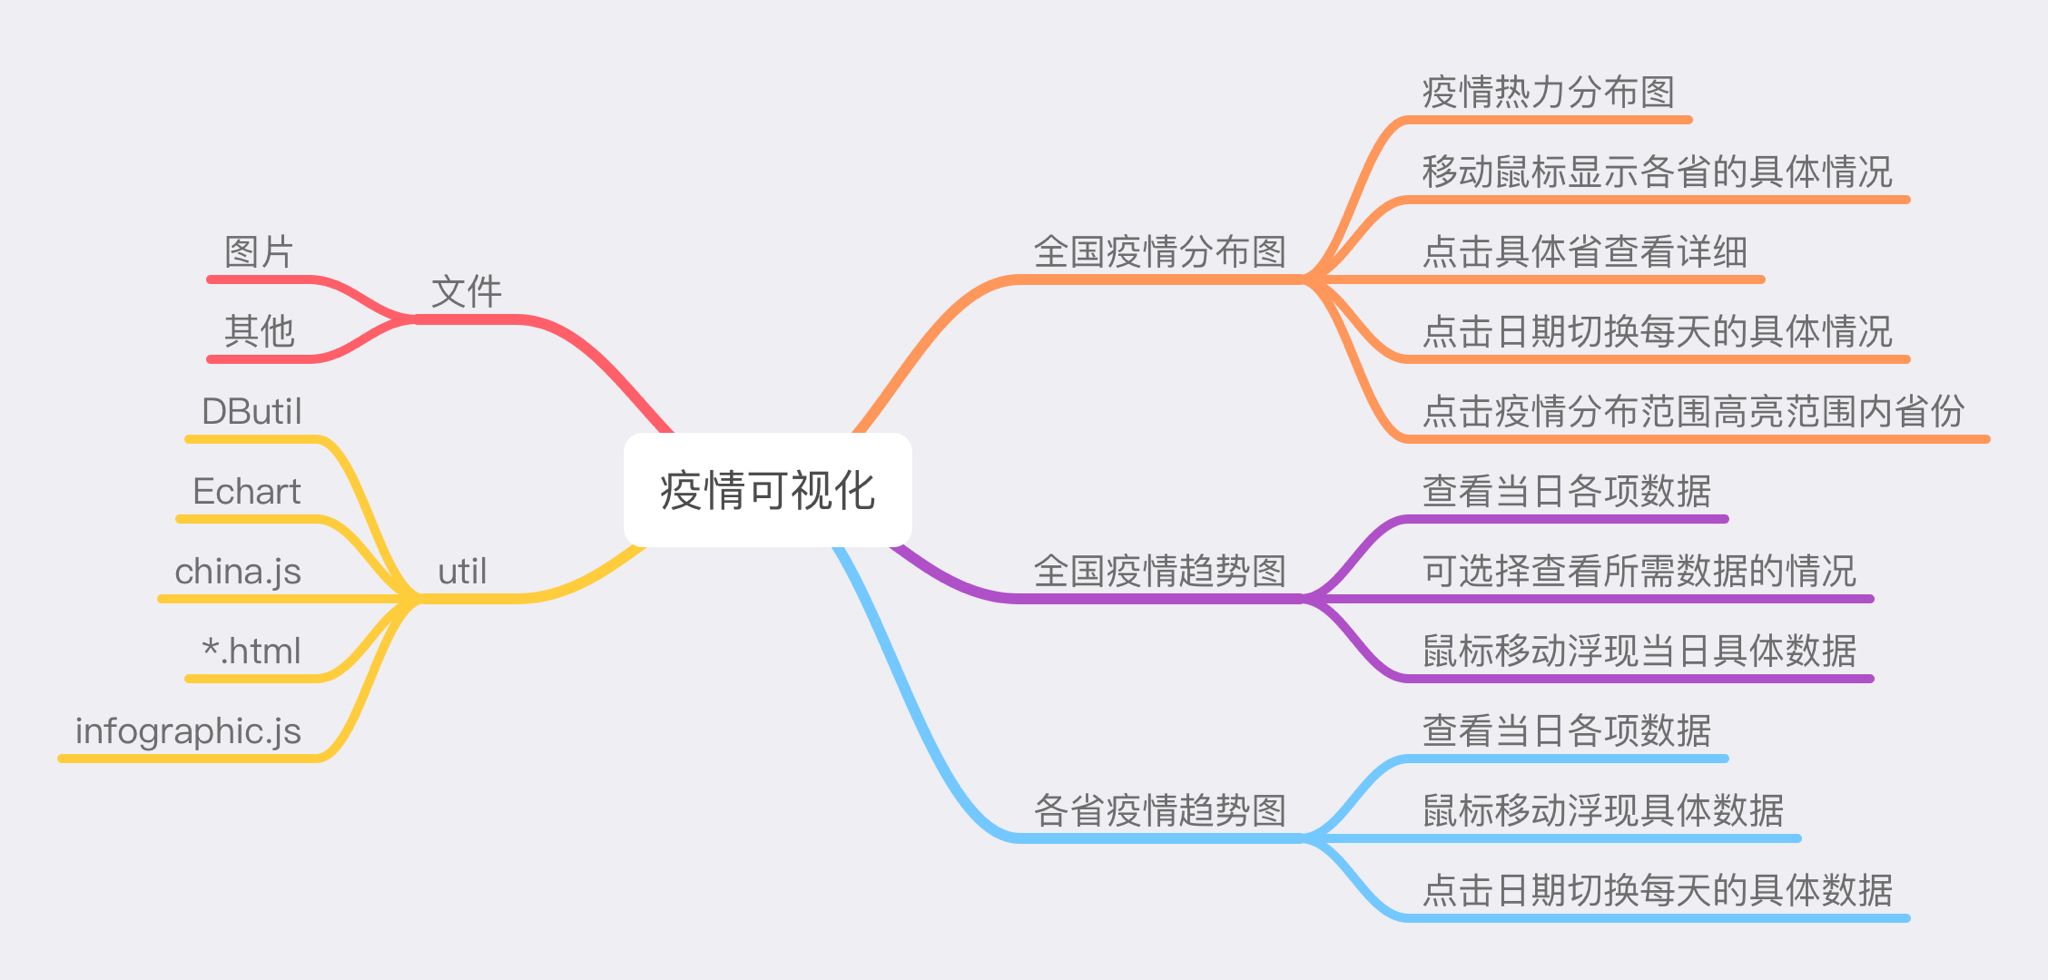
- 功能结构图
本次作业采用JavaWeb实现疫情可视化,将其分为前端和后端。前端显示视图,后端读取数据并存储在数据库中,在idea上创建InfectStatisticWeb,并且部署tomcat9.0服务器。
-
前端(221701433)
前端有两个页面,一个显示全国疫情数据,另一个显示选定省份的疫情数据。主页面有疫情地图和折线图,疫情地图可以显示当前确诊人数,点击省份跳转省份数据;副页面有该省份疫情数据及折线图。
本学期刚学习javaee,因此现学现用。将两个页面设置成JSP,并使用了echarts上的库图实现地图和折线图。数据方面,在后端从日志文件读取存入数据后,从数据库读取数据。 -
后端(221701411)
在进行分工之后,明确了我的任务主要在于对日志文件的读取和存储。
有了之前作业的经验,这次作业后端工作较为轻松,因此参与了部分前端的编写。 -
结构图

- 代码说明
Process中的main函数,运行后将日志文件中的数据存储到数据库中。
public static void main(String[] args) throws IOException, ParseException {
        delete();//清空province表
        connectMysql();

        String[] allContent = readFile("src/infectstatistic/log","2020-01-23");
        for (int i=0; i<allContent.length; i++){
            System.out.println(allContent[i]);
        }
        //RegularMatch.match(readFile("src/infectstatistic/log","2020-01-23"));
        for (Province province : RegularMatch.match( readFile("src/infectstatistic/log","2020-01-23"))){
            System.out.println(province.getName()+
                    " 感染"+province.getIp()+
                    " 疑似"+province.getSp()+
                    " 治愈"+province.getCure()+
                    " 死亡"+province.getDead()
            );
        }
        List name = getFileName("src/infectstatistic/log","2020-01-23");
        for (int i=0; i<name.size(); i++){
            System.out.println(name.get(i));
        }
}
Servlet控制前后端数据交互,实现页面跳转
String flag = req.getParameter("flag");
ProvinceDAO provinceDAO =new ProvinceDAOImpl();
//flag=2时跳转到第二个页面
if(flag != null && flag.equals("2")){
    String name = req.getParameter("name");
    String date = req.getParameter("Date");
    provinceDAO =new ProvinceDAOImpl();
    List<Province> local = provinceDAO.list(name,true);//获取当地每天数据
    int ip = 0,sp = 0,cure = 0,dead = 0;
    if(date != null){
        int year,month,day;
        int curYear = Integer.parseInt(date.substring(0,4));
        int curMonth = Integer.parseInt(date.substring(5,7));
        int curDay = Integer.parseInt(date.substring(8,10));
        for (Province province : local){
            year = Integer.parseInt(province.getDate().substring(0,4));
            month = Integer.parseInt(province.getDate().substring(5,7));
            day = Integer.parseInt(province.getDate().substring(8,10));
            //日期不超过的累加
            if(year == curYear){
                if(month == curMonth){
                    if(day <= curDay){
                        ip +=province.getIp();
                        sp += province.getSp();
                        cure += province.getCure();
                        dead += province.getDead();
                    }
                }
                else if(month < curMonth){
                    ip +=province.getIp();
                    sp += province.getSp();
                    cure += province.getCure();
                    dead += province.getDead();
                }
            }
            else if(year < curYear){
                ip +=province.getIp();
                sp += province.getSp();
                cure += province.getCure();
                dead += province.getDead();
            }
        }
        req.setAttribute("date",date);
    }
    else{
        //累加当地每天的数据
        for (Province province : local) {
            ip += province.getIp();
            sp += province.getSp();
            cure += province.getCure();
            dead += province.getDead();
        }
    }
    req.setAttribute("name",name);
    req.setAttribute("totalip",ip);
    req.setAttribute("totalsp",sp);
    req.setAttribute("totalcure",cure);
    req.setAttribute("totaldead",dead);
    req.setAttribute("local",local);
    //resp.setContentType("text/html;charset=UTF-8");
    req.setCharacterEncoding("UTF-8");
    resp.setCharacterEncoding("UTF-8");
    req.getRequestDispatcher("concreteInfectStatistic.jsp").forward(req,resp);
}
//否则跳转到第一个页面
else{
    String date = req.getParameter("Date");
    provinceDAO =new ProvinceDAOImpl();
    List<Province> country = provinceDAO.list("全国",true);//获取全国每天数据
    int ip = 0,sp = 0,cure = 0,dead = 0;
    if(date != null){
        int year,month,day;
        int curYear = Integer.parseInt(date.substring(0,4));
        int curMonth = Integer.parseInt(date.substring(5,7));
        int curDay = Integer.parseInt(date.substring(8,10));
        for(Province province : country){
            year = Integer.parseInt(province.getDate().substring(0,4));
            month = Integer.parseInt(province.getDate().substring(5,7));
            day = Integer.parseInt(province.getDate().substring(8,10));
        //日期不超过的累加
            if(year == curYear){
                if(month == curMonth){
                    if(day <= curDay){
                        ip +=province.getIp();
                        sp += province.getSp();
                        cure += province.getCure();
                        dead += province.getDead();
                    }
                }
                else if(month < curMonth){
                    ip +=province.getIp();
                    sp += province.getSp();
                    cure += province.getCure();
                    dead += province.getDead();
                }
            }
            else if(year < curYear){
                ip +=province.getIp();
                sp += province.getSp();
                cure += province.getCure();
                dead += province.getDead();
            }
        }
        String name;
        int eachIp;
        //查找每个省份的每天的确诊数据累加到一个数值上
        for(int i = 0; i < ProvinceName.provinceSize; i++) {
            name = ProvinceName.provinceName[i];
            eachIp = 0;
            List<Province> each = provinceDAO.list(name, true);//按省份名获取省份每天数据
            for(Province province : each){
                year = Integer.parseInt(province.getDate().substring(0,4));
                month = Integer.parseInt(province.getDate().substring(5,7));
                day = Integer.parseInt(province.getDate().substring(8,10));
                if(year == curYear){
                    if(month == curMonth){
                        if(day <= curDay){
                            eachIp += province.getIp();
                        }
                    }
                    else if(month < curMonth){
                        eachIp += province.getIp();
                    }
                }
                else if(year < curYear){
                    eachIp += province.getIp();
                }
            }
            req.setAttribute(name+"Ip",eachIp);
        }
        req.setAttribute("date",date);
    }
else{
该部分显示的是全国四种人数的折线图,用echarts定制的折线图样式,将获取的日期作为xAxis的数据、四种人数作为每个点的值,实现折线图。点击省份进入具体页面的折线图与之类似。
<div id="lineChart" style="width: 800px;height:400px; position: center; background-color: #ffffff; padding-top: 40px"></div>
<script type="text/javascript">

    var name = "全国";
    // 基于准备好的dom,初始化echarts实例
    var Chart = echarts.init(document.getElementById('lineChart'),'infographic');

    Chart.setOption({
        //设置标题
        title: {
            text: name + '疫情趋势'
        },
        //数据提示框
        tooltip: {
            trigger: 'axis',
        },
        legend: {
            data: ['确诊','疑似','治愈','死亡']
        },
        xAxis: {
            data:[<%
              List<Province> country = (List<Province>) request.getAttribute("country");
              String date;
              int ip,totalIp = 0;
              int sp,totalSp = 0;
              int cure,totalCure = 0;
              int dead,totalDead = 0;
              for(Province province : country){
                  date = province.getDate();
              %>
                "<%=date%>",
                <%}%>]
        },
        yAxis: {},
        series: [
            {
                name: '确诊',
                type: 'line',
                data:[<%
                  for(Province province : country){
                      ip = province.getIp();
                      totalIp += ip;
                  %>
                    <%=totalIp%>,
                    <%}%>]
            },
            {
                name: '疑似',
                type: 'line',
                data:[<%
                  for(Province province : country){
                      sp = province.getSp();
                      totalSp += sp;
                  %>
                    <%=totalSp%>,
                    <%}%>]
            },
            {
                name: '治愈',
                type: 'line',
                data:[<%
                  for(Province province : country){
                      cure = province.getCure();
                      totalCure += cure;
                  %>
                    <%=totalCure%>,
                    <%}%>]
            },
            {
                name: '死亡',
                type: 'line',
                data:[<%
                  for(Province province : country){
                      dead = province.getDead();
                      totalDead += dead;
                  %>
                    <%=totalDead%>,
                    <%}%>]
            }
        ]
    },true)
</script>
                        name: '疑似',
                        type: 'line',
                        data:[<%
                            for(Province province : local){
                                sp = province.getSp();
                                totalSp += sp;
                            %>
                            <%=totalSp%>,
                            <%}%>]
                    },
                    {
                        name: '治愈',
                        type: 'line',
                        data:[<%
                            for(Province province : local){
                                cure = province.getCure();
                                totalCure += cure;
                            %>
                            <%=totalCure%>,
                            <%}%>]
                    },
                    {
                        name: '死亡',
                        type: 'line',
                        data:[<%
                            for(Province province : local){
                                dead = province.getDead();
                                totalDead += dead;
                            %>
                            <%=totalDead%>,
                            <%}%>]
                    }
                ]
            })
</script>
<构建之法>阅读体会
在结对编程当中,可能双方都会遇见一些沟通,能力,想法等方面的差异,应该尽量调整自己,让自己可以适应队友的节奏,也体会到个人能力有限,每个人应该积极的参与到团队的项目建设当中,在团队中负责做好自己的部分,并且争取给他人一些帮助,结对编程的好处就是可以结合两个人的思想,比如在设计算法的时候,有很多情况都是结合了两个人的思想。还有就是在编程的时候,一个人编程另一个人在旁边能够及时的发现错误,大大提高了编程的效率。两个人一起编程可以提高积极性,一个人有时候在面对很多诱惑的时候就会怠慢很多。坏处就是沟通磨合需要一定的时间
结对总结与队友评价
221701411
结对总结:这次结对作业也算是第一次接触到可视化的相关项目,以前再做web实践的时候了解过一点点的echarts,所以这次我们打算就直接使用echarts来进行项目的开发,由于我对echarts的了解和学习不够赖同学的深入与渊博,所以我们这一次的结对作业呢,决定由赖同学来牵头,我来进行后端的编写,我的任务主要在于对>日志文件的读取和存储。 有了之前作业的经验,这次作业后端工作较为轻松,因此参与了部分前端的编写。
队友评价:队友很好!很给力,博学渊实,很厉害的队友,希望下次有机会还可以继续合作!!!
221701433
结对总结:这次结对作业,我对前端相对较熟悉,所以和代同学讨论决定我来负责这次项目的牵头,我心里想好了大致的开发思路:前端有两个页面,一个显示全国疫情数据,另一个显示选定省份的疫情数据。主页面有疫情地图和折线图,疫情地图可以显示当前确诊人数,点击省份跳转省份数据;副页面有该省份疫情数据及折线图。
本学期刚学习javaee,因此现学现用。将两个页面设置成JSP,并使用了echarts上的库图实现地图和折线图。数据方面,在后端从日志文件读取存入数据后,从数据库读取数据。
队友评价:队友很不错,很给力,这次体验很棒,队友也十分愿意查找资料,共同学习,期待有下一次机会一起合作!!!


