习题8.4
import numpy as np
import pandas as pd
import sympy as sp
sp.init_printing(use_latex=True)
from scipy.integrate import odeint
import matplotlib.pyplot as plt
plt.rcParams['font.sans-serif']=['Times New Roman + SimSun + WFM Sans SC']
plt.rcParams['mathtext.fontset']='stix'
# Times New Roman + SimSun + WFM Sans SC
# simsum宋体, times new roman -*, simhei黑体, kaiti楷体,
# dengxian等线, fangsong仿宋, Microsoft Yahei微软雅黑
plt.rcParams['axes.unicode_minus']=False
plt.rcParams['figure.dpi'] = 200
# plt.rcParams['figure.figsize'] = [4, 3]
# plt.rcParams['font.size'] = 12
plt.rcParams['xtick.direction']='in'
plt.rcParams['ytick.direction']='in'
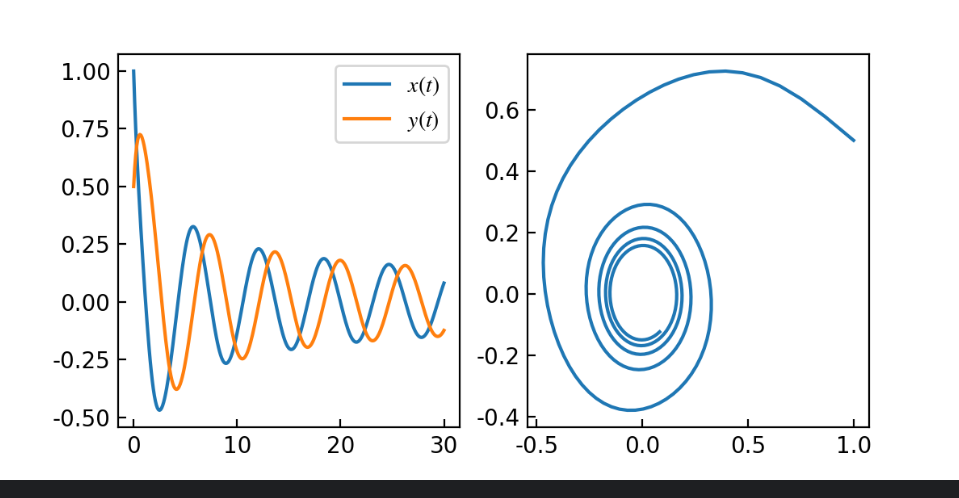
def rhs(f, t):
x, y = f
return [
-x**3 - y,
x - y**3,
]
tt = np.linspace(0, 30, 301)
ns = odeint(rhs, [1, 0.5], tt)
xx, yy = ns[:,0], ns[:,1]
fig = plt.figure(figsize=(6,3))
ax = fig.add_subplot(121)
ax.plot(tt, xx, label='$x(t)$')
ax.plot(tt, yy, label='$y(t)$')
ax.legend()
ax1 = fig.add_subplot(122)
ax1.plot(xx, yy)
fig.show()