Numpy与Matplotlib读书笔记


引用numpy库:
![]()
![]() :
:
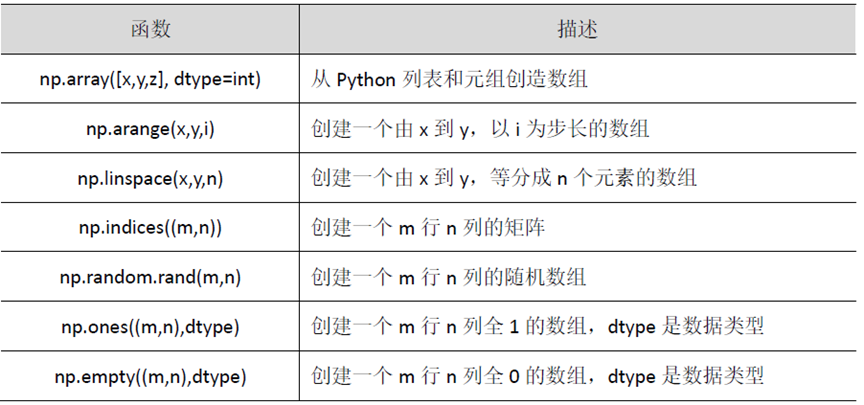
![]() :
:

 :
:
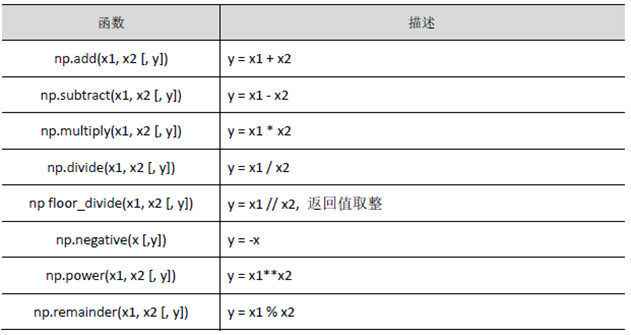
 :
:
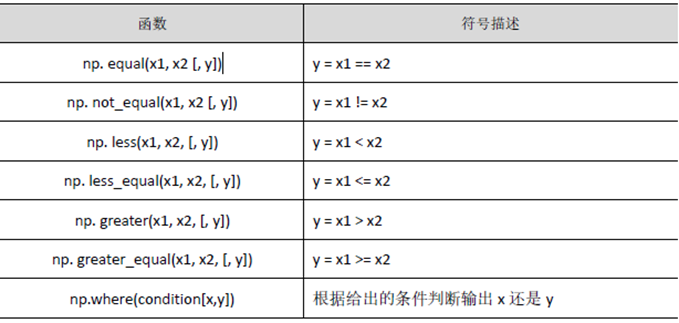
![]() :
:
Matplotlib
Matplotlib是Python中最基本也最重要的可视化工具,可以画出拥有出版质量(Publication-Quality)的图表。如今Matplotlib已经衍生出了很多高层库,但如果需要对图表进行更加精细的个性化设置,就必须深入学习Matplotlib,教程和案例就是最好的学习资源。
https://www.kesci.com/home/column/5b87a78131902f000f668549?from=zhihu
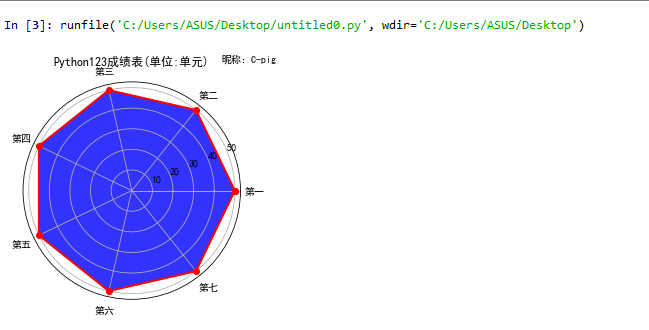
用Matplotlib和numpy制作雷达图

 1 #DrawDota.py
 2 import numpy as np
 3 import matplotlib.pyplot as plt
 4 import matplotlib
 5 matplotlib.rcParams['font.family']='SimHei'
 6 matplotlib.rcParams['font.sans-serif']=['SimHei']
 7 labels = np.array(['第一','第二','第三','第四','第五','第六','第七'])
 8 nAttr = 7
 9 data = np.array([50,50,50,50,50,50,50])#数据值
10 angles = np.linspace(0,2*np.pi,nAttr,endpoint=False)
11 data = np.concatenate((data,[data[0]]))#连接data和data[0]
12 angles = np.concatenate((angles,[angles[0]]))#连接angles和angles[0]
13 fig = plt.figure(facecolor="white")#创建一个全局绘图区域
14 plt.subplot(111,polar=True)
15 plt.title('Python123成绩表(单位:单元)')
16 plt.plot(angles,data,'bo-',color='r',linewidth=2)
17 plt.fill(angles,data,facecolor='b',alpha=0.8)
18 plt.thetagrids(angles*180/np.pi,labels)#在各个angles的位置上标记上对应的labels
19 plt.figtext(0.72,0.95,'昵称:C-pig')#为全局绘图区添加文字
20 plt.grid(True)
21 plt.show()
