MySQL调优性能监控之show profile
用show profile查询工具指定具体的type
show profile在mysql5.7之后过时
show profile命令用于跟踪执行过的sql语句的资源消耗信息,可以帮助查看sql语句的执行情况,可以在做性能分析或者问题诊断的时候作为参考。在MySQL5.7中, show profile命令已经开始不推荐使用,MySQL使用performance_schema 中系统表的信息来替代show profile命令,这儿主要是研究资源性能监控的思路。
SHOW PROFILE [type [, type] ... ]
    [FOR QUERY n]
    [LIMIT row_count [OFFSET offset]]

type:
    ALL
  | BLOCK IO
  | CONTEXT SWITCHES
  | CPU
  | IPC
  | MEMORY
  | PAGE FAULTS
  | SOURCE
  | SWAPS
此工具默认是禁用的,首先打开show profile跟踪记录SQL执行情况的配置,可以通过服务器变量在会话级别动态的修改:
mysql> set profiling = 1;
Query OK, 0 rows affected, 1 warning (0.00 sec)
当设置完成之后,在服务器上执行的所有语句,都会测量其耗费的时间和其他一些查询执行状态变更相关的数据。
以下面查询语句举例:
mysql> select * from emp;
+-------+--------+-----------+------+------------+---------+---------+--------+
| empno | ename  | job       | mgr  | hiredate   | sal     | comm    | deptno |
+-------+--------+-----------+------+------------+---------+---------+--------+
|  7369 | SMITH  | CLERK     | 7902 | 1980-12-17 |  800.00 |    NULL |     20 |
|  7499 | ALLEN  | SALESMAN  | 7698 | 1981-02-20 | 1600.00 |  300.00 |     30 |
|  7521 | WARD   | SALESMAN  | 7698 | 1981-02-22 | 1250.00 |  500.00 |     30 |
|  7566 | JONES  | MANAGER   | 7839 | 1981-04-02 | 2975.00 |    NULL |     20 |
|  7654 | MARTIN | SALESMAN  | 7698 | 1981-09-28 | 1250.00 | 1400.00 |     30 |
|  7698 | BLAKE  | MANAGER   | 7839 | 1981-05-01 | 2850.00 |    NULL |     30 |
|  7782 | CLARK  | MANAGER   | 7839 | 1981-06-09 | 2450.00 |    NULL |     10 |
|  7788 | SCOTT  | ANALYST   | 7566 | 1987-07-13 | 3000.00 |    NULL |     20 |
|  7839 | KING   | PRESIDENT | NULL | 1981-11-17 | 5000.00 |    NULL |     10 |
|  7844 | TURNER | SALESMAN  | 7698 | 1981-09-08 | 1500.00 |    0.00 |     30 |
|  7876 | ADAMS  | CLERK     | 7788 | 1987-07-13 | 1100.00 |    NULL |     20 |
|  7900 | JAMES  | CLERK     | 7698 | 1981-12-03 |  950.00 |    NULL |     30 |
|  7902 | FORD   | ANALYST   | 7566 | 1981-12-03 | 3000.00 |    NULL |     20 |
|  7934 | MILLER | CLERK     | 7782 | 1982-01-23 | 1300.00 |    NULL |     10 |
+-------+--------+-----------+------+------------+---------+---------+--------+
14 rows in set (0.01 sec)
在mysql的命令行模式下只能显示两位小数的时间,可以使用如下命令查看具体的执行时间
mysql> show profiles;
+----------+------------+-------------------+
| Query_ID | Duration   | Query             |
+----------+------------+-------------------+
|        1 | 0.00130500 | show databases    |
|        2 | 0.00010250 | SELECT DATABASE() |
|        3 | 0.00027500 | show databases    |
|        4 | 0.00023075 | show tables       |
|        5 | 0.00041800 | show databases    |
|        6 | 0.00018925 | show tables       |
|        7 | 0.00376825 | select * from emp |
+----------+------------+-------------------+
7 rows in set, 1 warning (0.00 sec)
上面一共有7条sql语句操作,执行如下命令可以查看详细的每个步骤的时间,这儿以Query_ID = 1的语句举例子:
mysql> show profile for query 1 ;
+----------------------+----------+
| Status               | Duration |
+----------------------+----------+
| starting             | 0.000089 |
| checking permissions | 0.000025 |
| Opening tables       | 0.000062 |
| init                 | 0.000036 |
| System lock          | 0.000007 |
| optimizing           | 0.000004 |
| statistics           | 0.000023 |
| preparing            | 0.000039 |
| executing            | 0.000910 |
| Sending data         | 0.000019 |
| end                  | 0.000016 |
| query end            | 0.000006 |
| closing tables       | 0.000002 |
| removing tmp table   | 0.000004 |
| closing tables       | 0.000016 |
| freeing items        | 0.000013 |
| cleaning up          | 0.000036 |
+----------------------+----------+
17 rows in set, 1 warning (0.00 sec)
除了query n指定Query_ID外,还可以设置Type查看MYSQL语句执行的其他信息,type主要参数如下:
all:显示所有性能信息
block io:显示块io操作的次数
context switches:显示上下文切换次数,被动和主动
cpu:显示用户cpu时间、系统cpu时间
IPC:显示发送和接受的消息数量
Memory:暂未实现
page faults:显示页错误数量
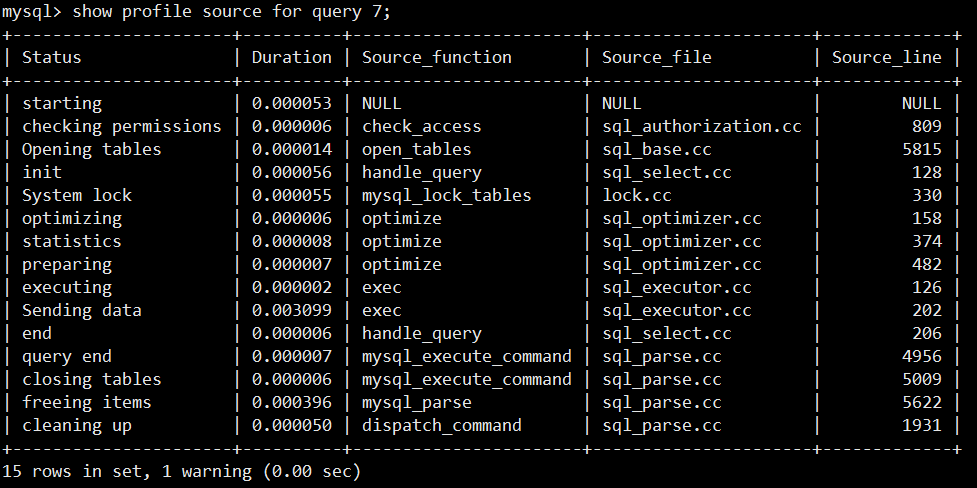
source:显示源码中的函数名称与位置
swaps:显示swap的次数
##all显示内容太宽,这儿暂不显示
mysql> show profile all for query 7;
block io
# block io
mysql> mysql> show  profile block io fo 7;
+----------------------+----------+--------------+---------------+
| Status               | Duration | Block_ops_in | Block_ops_out |
+----------------------+----------+--------------+---------------+
| starting             | 0.000053 |            0 |             0 |
| checking permissions | 0.000006 |            0 |             0 |
| Opening tables       | 0.000014 |            0 |             0 |
| init                 | 0.000056 |            0 |             0 |
| System lock          | 0.000055 |            0 |             0 |
| optimizing           | 0.000006 |            0 |             0 |
| statistics           | 0.000008 |            0 |             0 |
| preparing            | 0.000007 |            0 |             0 |
| executing            | 0.000002 |            0 |             0 |
| Sending data         | 0.003099 |            0 |             0 |
| end                  | 0.000006 |            0 |             0 |
| query end            | 0.000007 |            0 |             0 |
| closing tables       | 0.000006 |            0 |             0 |
| freeing items        | 0.000396 |            0 |             0 |
| cleaning up          | 0.000050 |            0 |             0 |
+----------------------+----------+--------------+---------------+
15 rows in set, 1 warning (0.00 sec)
context switches
#context switches
mysql> show profile context switches for query 1;
+----------------------+----------+-------------------+---------------------+
| Status               | Duration | Context_voluntary | Context_involuntary |
+----------------------+----------+-------------------+---------------------+
| starting             | 0.000089 |                 0 |                   0 |
| checking permissions | 0.000025 |                 0 |                   0 |
| Opening tables       | 0.000062 |                 0 |                   0 |
| init                 | 0.000036 |                 0 |                   0 |
| System lock          | 0.000007 |                 0 |                   0 |
| optimizing           | 0.000004 |                 0 |                   0 |
| statistics           | 0.000023 |                 0 |                   0 |
| preparing            | 0.000039 |                 0 |                   0 |
| executing            | 0.000910 |                 0 |                   0 |
| Sending data         | 0.000019 |                 0 |                   0 |
| end                  | 0.000016 |                 0 |                   0 |
| query end            | 0.000006 |                 0 |                   0 |
| closing tables       | 0.000002 |                 0 |                   0 |
| removing tmp table   | 0.000004 |                 0 |                   0 |
| closing tables       | 0.000016 |                 0 |                   0 |
| freeing items        | 0.000013 |                 0 |                   0 |
| cleaning up          | 0.000036 |                 0 |                   0 |
+----------------------+----------+-------------------+---------------------+
17 rows in set, 1 warning (0.00 sec)
cpu
#cpu
mysql> show profile cpu for query 7;
+----------------------+----------+----------+------------+
| Status               | Duration | CPU_user | CPU_system |
+----------------------+----------+----------+------------+
| starting             | 0.000053 | 0.000000 |   0.000000 |
| checking permissions | 0.000006 | 0.000000 |   0.000000 |
| Opening tables       | 0.000014 | 0.000000 |   0.000000 |
| init                 | 0.000056 | 0.000000 |   0.000000 |
| System lock          | 0.000055 | 0.000000 |   0.000000 |
| optimizing           | 0.000006 | 0.000000 |   0.000000 |
| statistics           | 0.000008 | 0.000000 |   0.000000 |
| preparing            | 0.000007 | 0.000000 |   0.000000 |
| executing            | 0.000002 | 0.000000 |   0.000000 |
| Sending data         | 0.003099 | 0.002000 |   0.000000 |
| end                  | 0.000006 | 0.000000 |   0.000000 |
| query end            | 0.000007 | 0.000000 |   0.000000 |
| closing tables       | 0.000006 | 0.000000 |   0.000000 |
| freeing items        | 0.000396 | 0.001000 |   0.000000 |
| cleaning up          | 0.000050 | 0.000000 |   0.000000 |
+----------------------+----------+----------+------------+
15 rows in set, 1 warning (0.00 sec)
ipc
#ipc
mysql> show profile ipc for query 1;
+----------------------+----------+---------------+-------------------+
| Status               | Duration | Messages_sent | Messages_received |
+----------------------+----------+---------------+-------------------+
| starting             | 0.000089 |             0 |                 0 |
| checking permissions | 0.000025 |             0 |                 0 |
| Opening tables       | 0.000062 |             0 |                 0 |
| init                 | 0.000036 |             0 |                 0 |
| System lock          | 0.000007 |             0 |                 0 |
| optimizing           | 0.000004 |             0 |                 0 |
| statistics           | 0.000023 |             0 |                 0 |
| preparing            | 0.000039 |             0 |                 0 |
| executing            | 0.000910 |             0 |                 0 |
| Sending data         | 0.000019 |             0 |                 0 |
| end                  | 0.000016 |             0 |                 0 |
| query end            | 0.000006 |             0 |                 0 |
| closing tables       | 0.000002 |             0 |                 0 |
| removing tmp table   | 0.000004 |             0 |                 0 |
| closing tables       | 0.000016 |             0 |                 0 |
| freeing items        | 0.000013 |             0 |                 0 |
| cleaning up          | 0.000036 |             0 |                 0 |
+----------------------+----------+---------------+-------------------+
17 rows in set, 1 warning (0.00 sec)
page faults
# page faults
mysql> show profile page faults for query 1;
+----------------------+----------+-------------------+-------------------+
| Status               | Duration | Page_faults_major | Page_faults_minor |
+----------------------+----------+-------------------+-------------------+
| starting             | 0.000089 |                 0 |                 0 |
| checking permissions | 0.000025 |                 0 |                 0 |
| Opening tables       | 0.000062 |                 0 |                 0 |
| init                 | 0.000036 |                 0 |                 0 |
| System lock          | 0.000007 |                 0 |                 0 |
| optimizing           | 0.000004 |                 0 |                 0 |
| statistics           | 0.000023 |                 0 |                 0 |
| preparing            | 0.000039 |                 0 |                 0 |
| executing            | 0.000910 |                 0 |                 1 |
| Sending data         | 0.000019 |                 0 |                 0 |
| end                  | 0.000016 |                 0 |                 0 |
| query end            | 0.000006 |                 0 |                 0 |
| closing tables       | 0.000002 |                 0 |                 0 |
| removing tmp table   | 0.000004 |                 0 |                 0 |
| closing tables       | 0.000016 |                 0 |                 0 |
| freeing items        | 0.000013 |                 0 |                 0 |
| cleaning up          | 0.000036 |                 0 |                 0 |
+----------------------+----------+-------------------+-------------------+
17 rows in set, 1 warning (0.00 sec)
source
swaps
# swaps
mysql> show profile swaps for query 7;
+----------------------+----------+-------+
| Status               | Duration | Swaps |
+----------------------+----------+-------+
| starting             | 0.000053 |     0 |
| checking permissions | 0.000006 |     0 |
| Opening tables       | 0.000014 |     0 |
| init                 | 0.000056 |     0 |
| System lock          | 0.000055 |     0 |
| optimizing           | 0.000006 |     0 |
| statistics           | 0.000008 |     0 |
| preparing            | 0.000007 |     0 |
| executing            | 0.000002 |     0 |
| Sending data         | 0.003099 |     0 |
| end                  | 0.000006 |     0 |
| query end            | 0.000007 |     0 |
| closing tables       | 0.000006 |     0 |
| freeing items        | 0.000396 |     0 |
| cleaning up          | 0.000050 |     0 |
+----------------------+----------+-------+
15 rows in set, 1 warning (0.00 sec)

 浙公网安备 33010602011771号