UNSW CV week3 上 Feature Representation
https://echo360.org.au/lesson/61104790-7374-4fb6-90f9-e6727c6f20e2/classroom#sortDirection=desc
https://webcms3.cse.unsw.edu.au/COMP9517/20T2/resources/46773
总结:
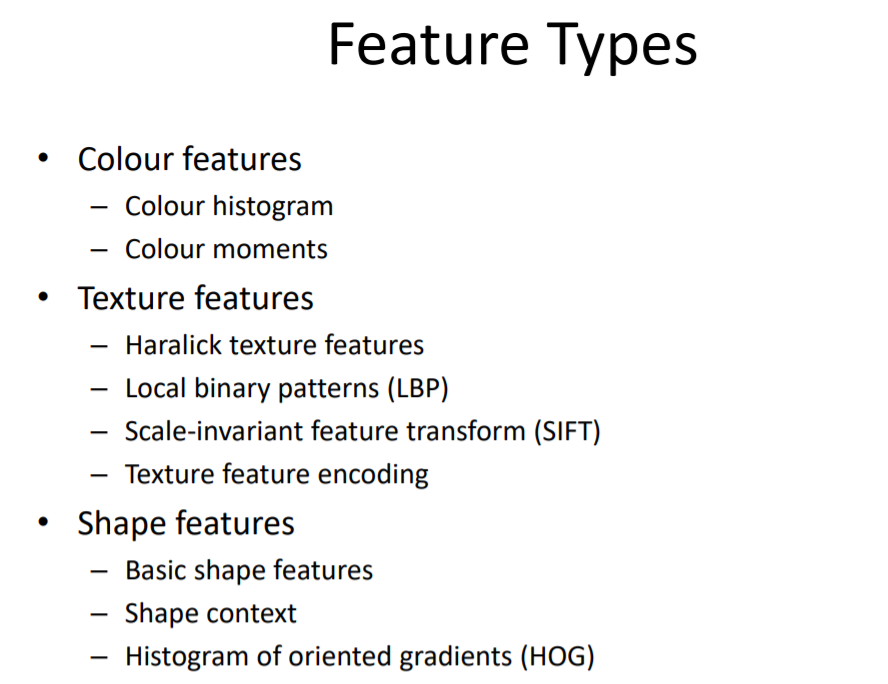
目的:
1000*1000的图像就有一百万个像素点,如果以此来操作太computational-expensive。提取features更方便和robust

Intuitive examples of image features:
– Blobs 比如白云
– Edges from dark to bright
– Corners
– Ridges from dark to bright to dark again
– Circles
– Ellipses
– Lines
– Etc…
Colour Features:
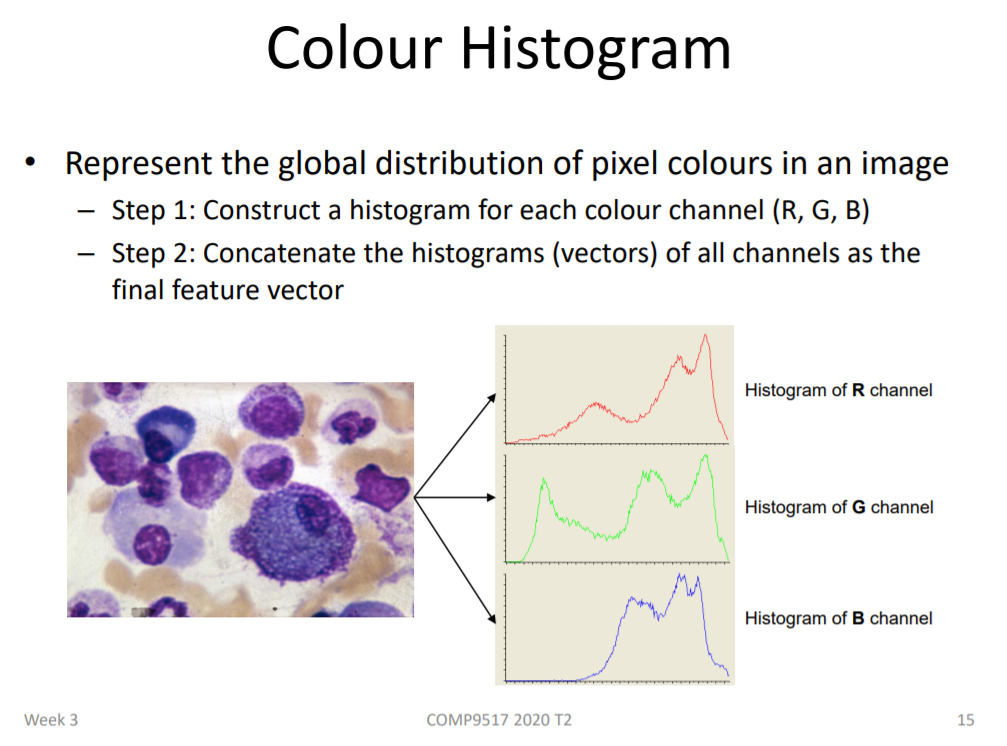
1. Colour Histogram:
操作: RGB三色直方图,每色有256个可选intensity,直方图的高度即为每个值对应的pixels的数量,这样一个直方图可以用一个 256维的vector
RGB三色即有768维的vector,which is still very big and need to be reduced
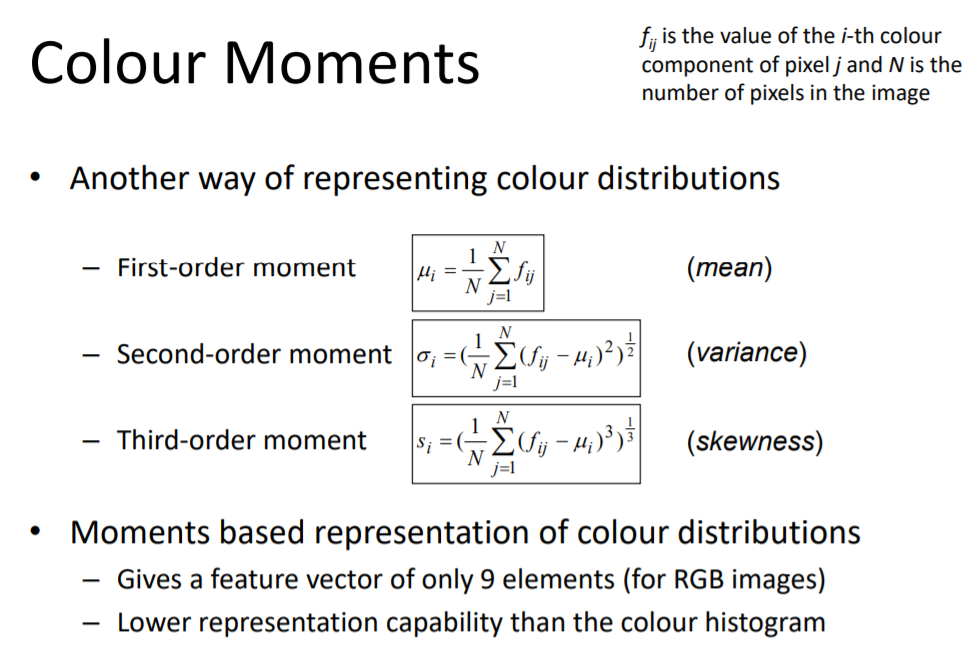
2. Colour Moments:
1)只取RGB每个channel的 First/Second/Third Order,得到一个 9维vector,一般前两/三个Order就够了;
2)当然9维Vector没有直方图的768维Vector含有的信息多,我们需要做Trade-off。
Texture Features
1. Haralick Features :
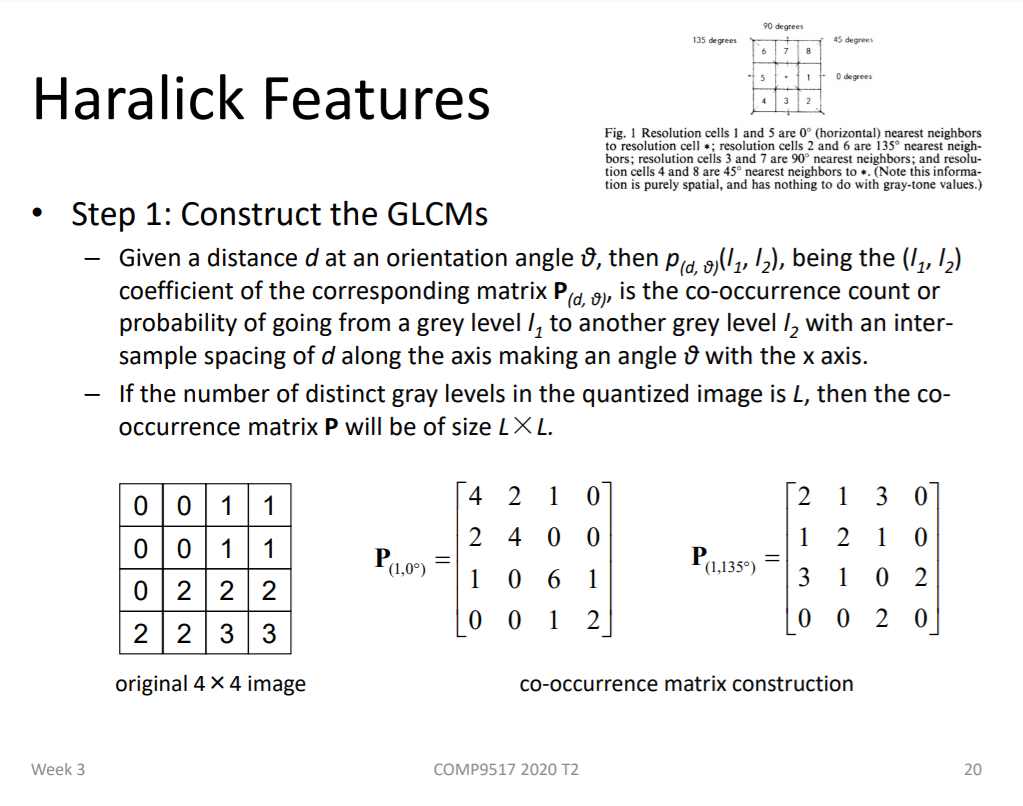
1) 以下图为例,左一图为给定的Input,生成以距离,角度为参数的matrix;
左二图 P(1,0°)即为图中距离为1,角度为0°或180°中能互相到达的像素的数量
比如P(1,0°)[ 0,0 ] = 4; 即为左一图中,intensity 0 能到达 intensity 0 在距离为1的neighbourhood矩阵中,角度为 0°或180°,能互相到达4次。
即 Matrix[0,0] -> Maxtrix[0,1] Matrix[0,1] -> Maxtrix[0,0] Matrix[1,0] -> Maxtrix[1,1] Matrix[1,1] -> Maxtrix[1,0] 4次 (Matrix即为左一Input)
P(1,0°)[ 2,2 ] = 6; 即为 Matrix[2,1] -> Maxtrix[2,2] Matrix[2,2] -> Maxtrix[2,1] Matrix[2,2] -> Maxtrix[2,3] Matrix[2,3] -> Maxtrix[2,2]
Matrix[3,0] -> Maxtrix[3,1] Matrix[3,1] -> Maxtrix[3,0]
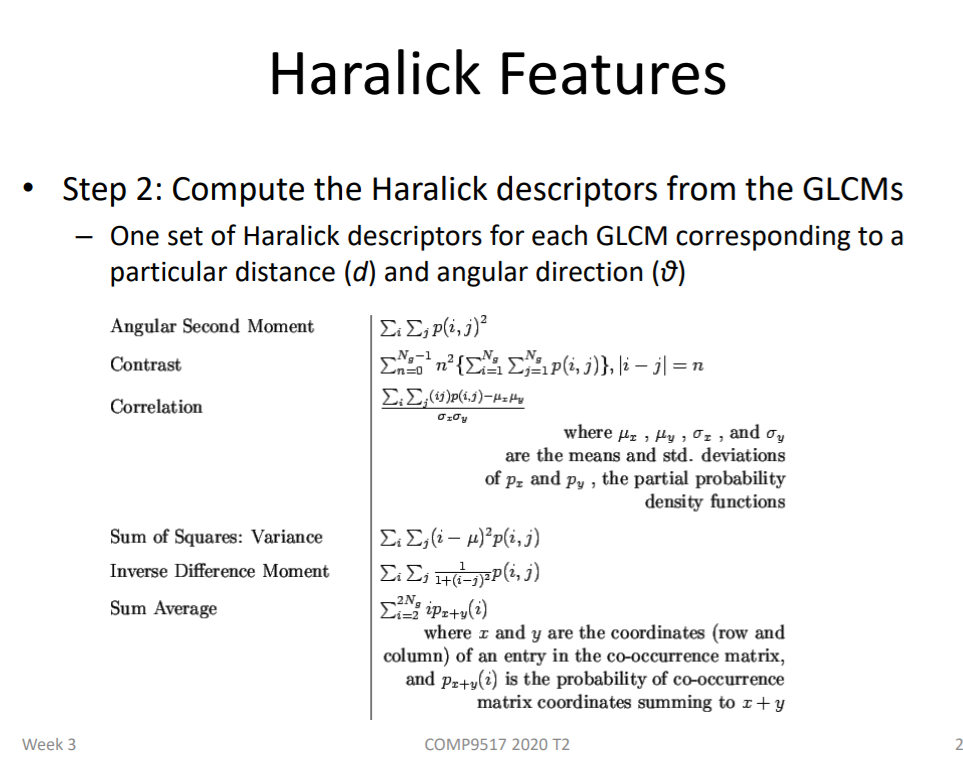
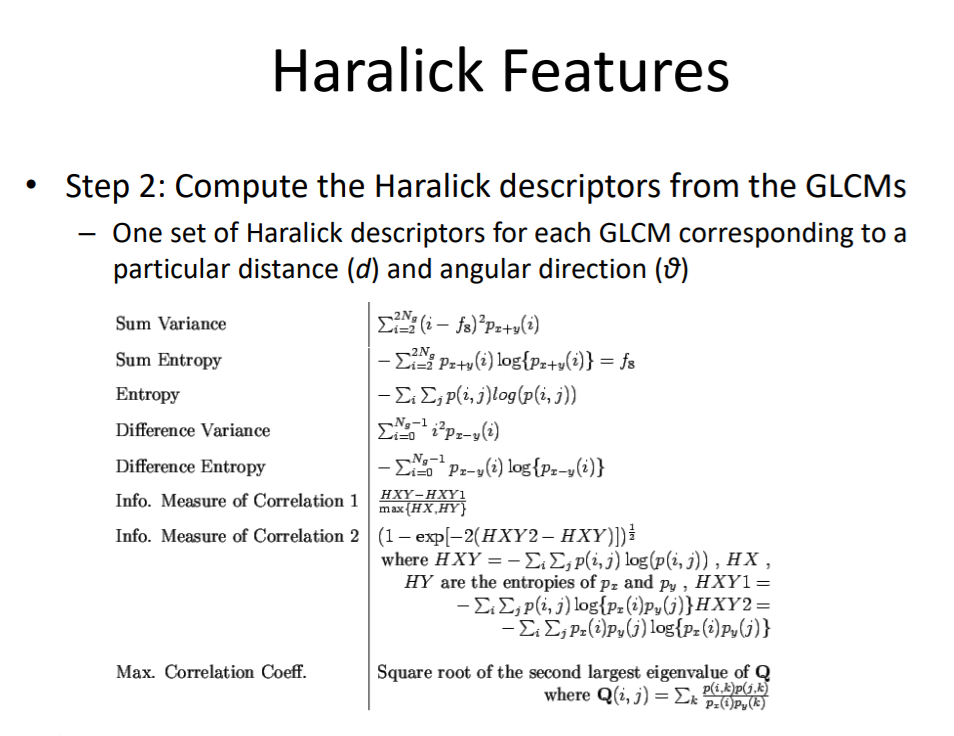
2) 从创建的GLCMs矩阵中提取features/descriptors:方差,熵
3)举例
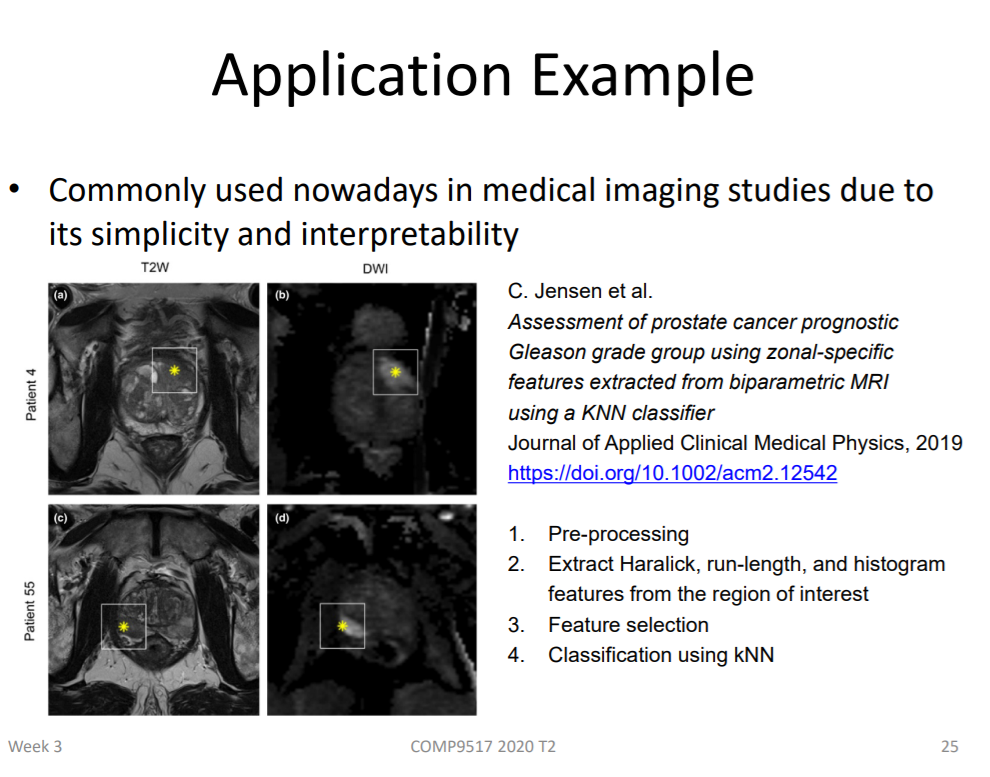
预处理,提取各种features from ROI,特征选择,分类
2. Local Binary Patterns (LBP)
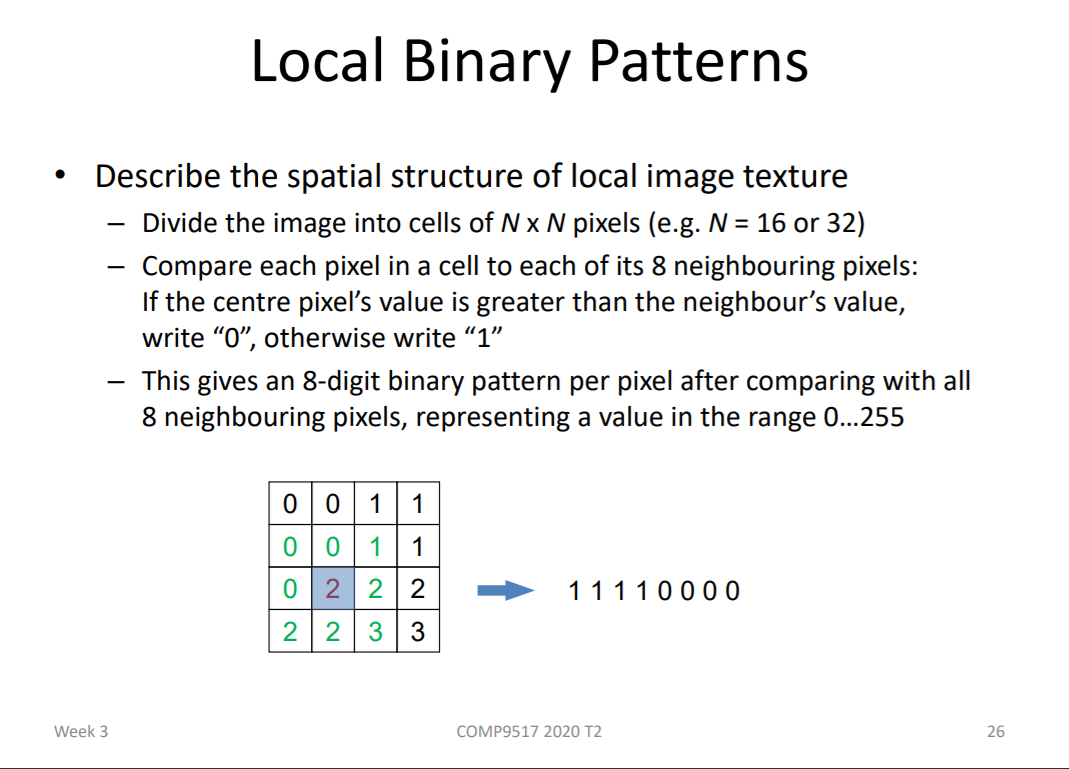
1) 把图片分成N*N的cells
2)对cell中的每个pixel比较其周围8个pixels的的大小,中心value大,对应位填0;其他填1
例如下图 2比 0 0 0 1 大,小于等于 2 2 2 3,所以得到8位LBP 11110000
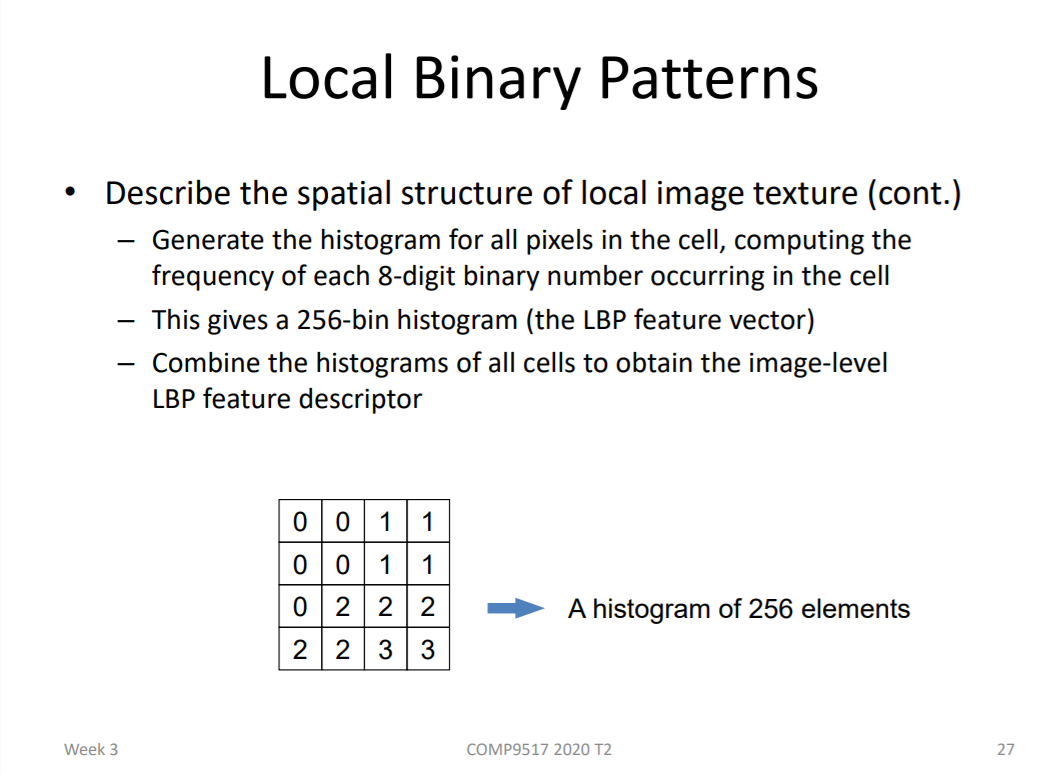
3) 每个像素对应的8位LBP有2^8=256种可能性(每位可取0,1)。对每个cell的LBP情况做一个直方图,统计256种情况出现的次数。
4) 将所有cells的直方图combine在一起得到image-level的LBP feature descriptor.
5) 变种
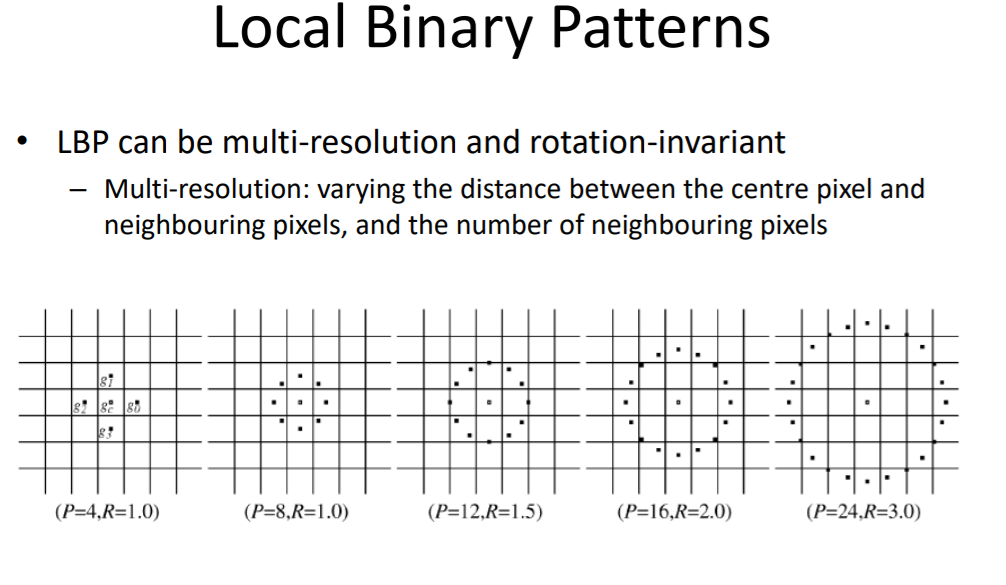
(1)将上述选取距离为1的8个邻居判断 记为P=8,R=1;
(2)由此可延申出多种LBP 如 P=12 R = 1.5 等
6) 改进
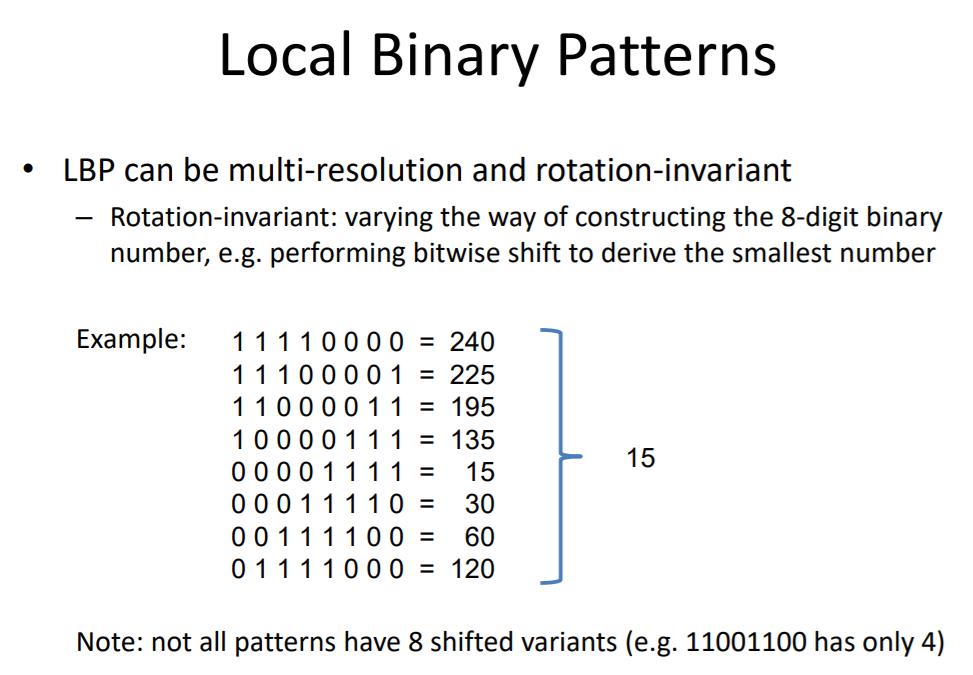
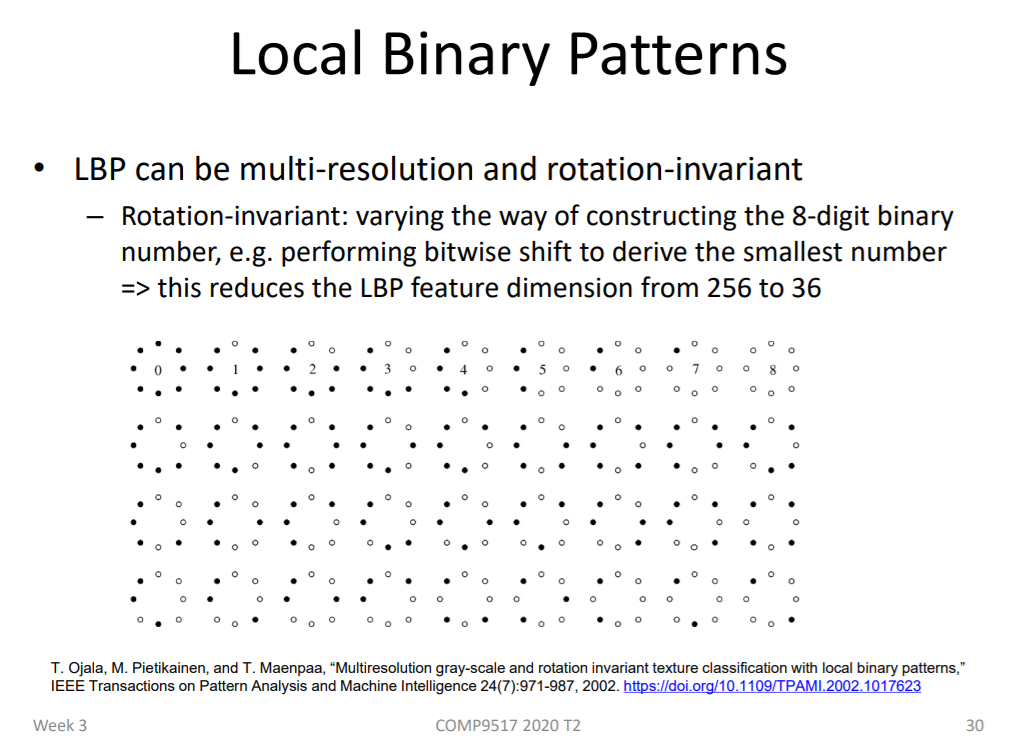
(1)由于P=8,R=1时,得到的8位LBP具有可旋转性;
(2)选取8种旋转情况中,二进制最小值为取值
即 11110000(240) -》00001111(15)
(3)这样256种取值可简化至36种
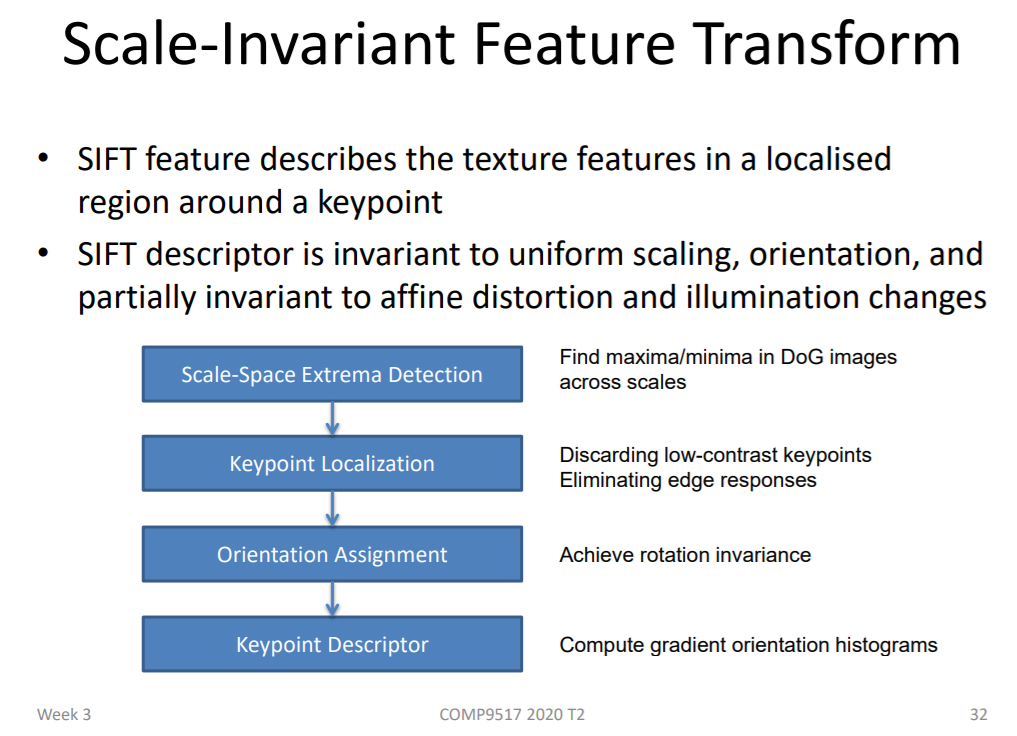
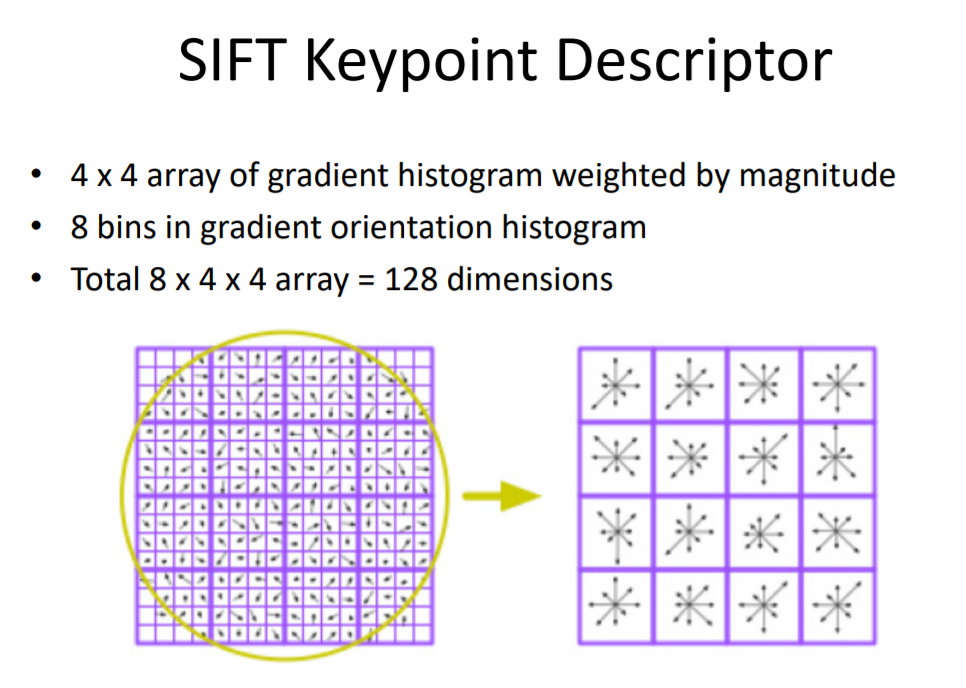
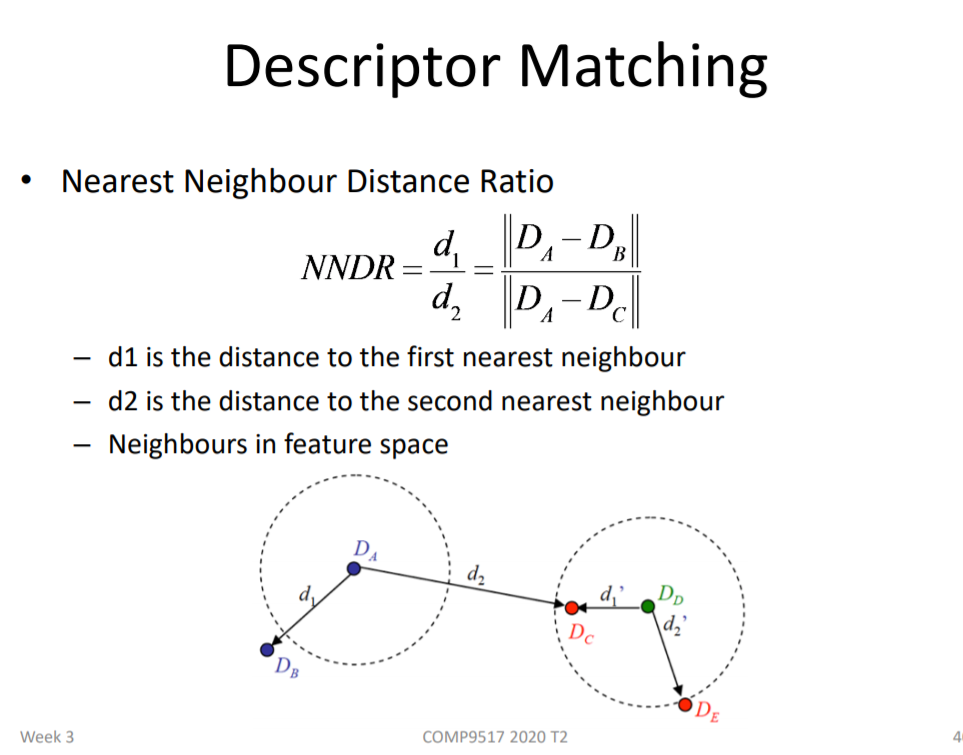
3. Scale-invariant feature transform (SIFT)
https://blog.csdn.net/u010440456/article/details/81483145
1)SIFT descriptor is invariant to 缩放,方向; partially invariant 失真,光照变化;
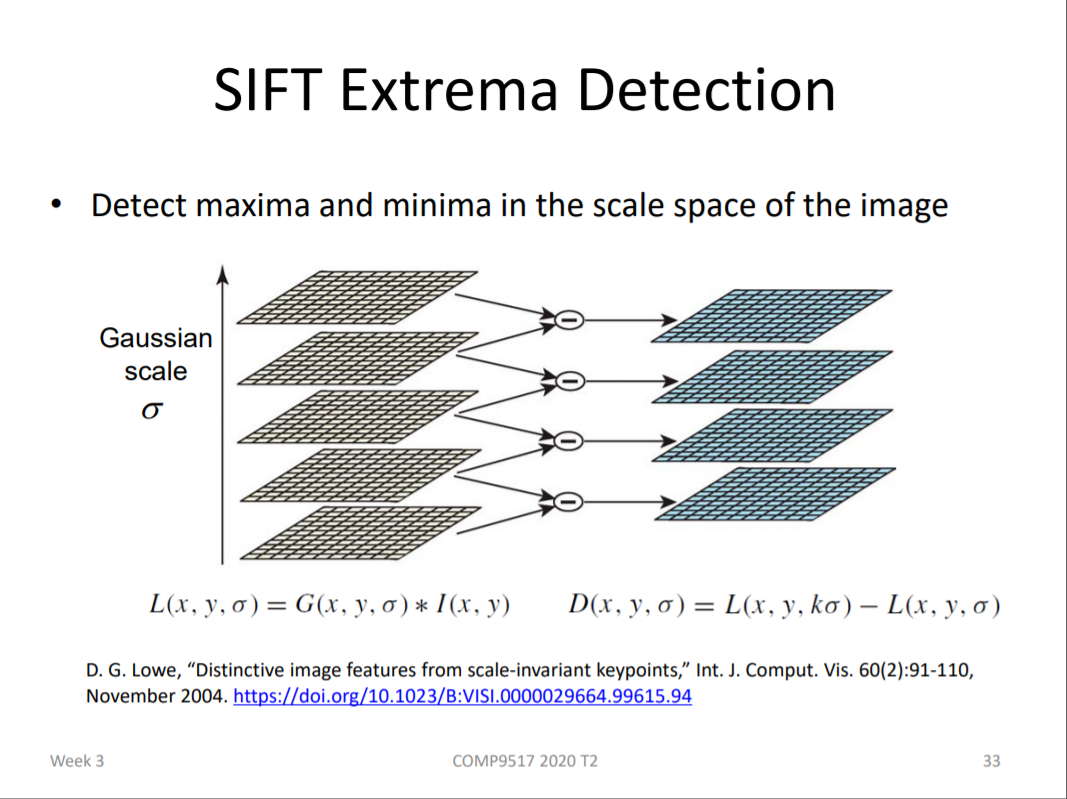
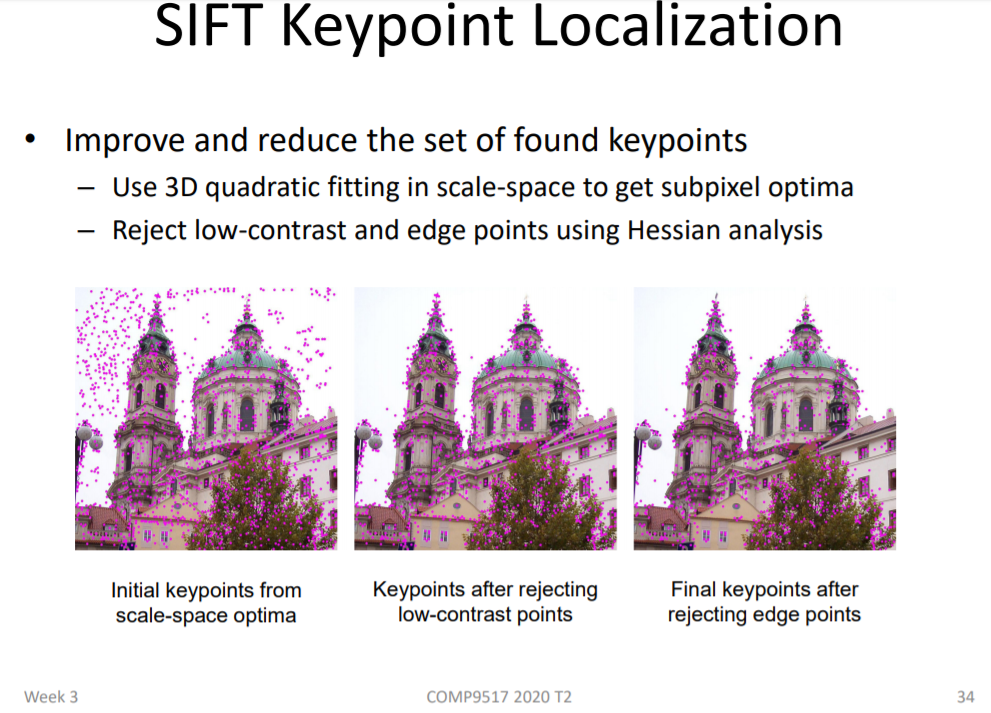
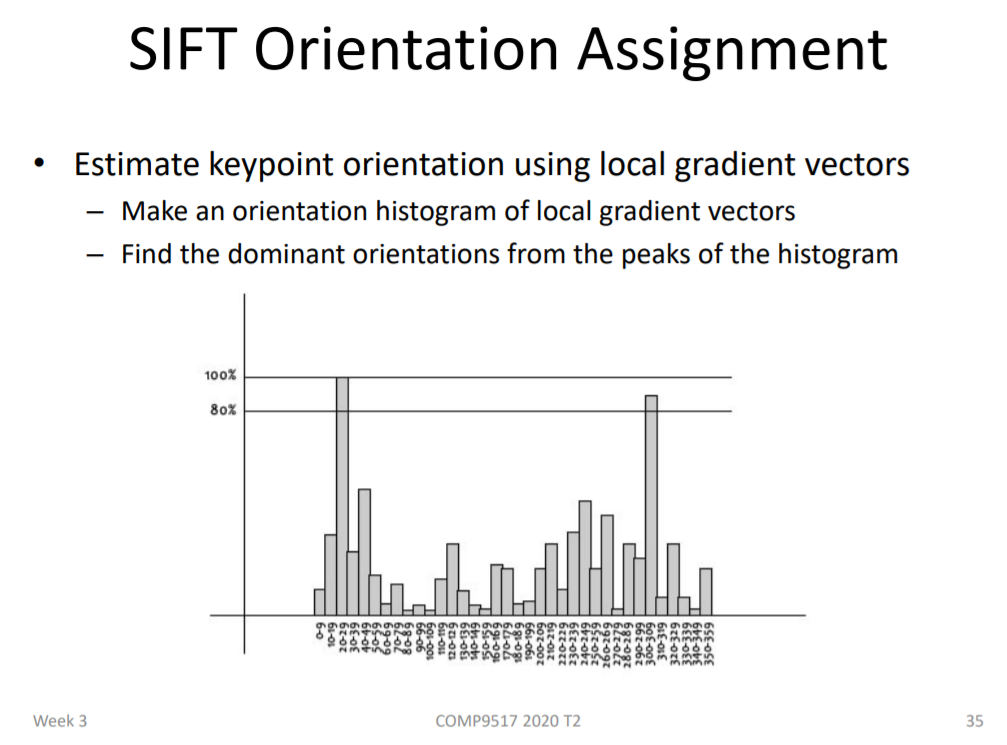
2) 步骤:
(1)找到所有 Difference of Gaussian 图片中的 极值点 作为keypoint
(2)除掉low-contrast和edge 上的一些keypoint
(3)用梯度向量计算方向(不会 - - 好复杂)
(4)计算梯度方向直方图(放弃了)
