
Why for-range behave differently depending on the size of the element
原文地址
https://labs.yulrizka.com/en/why-for-range-behave-differently-depending-on-the-size-of-the-element/
package main

import "testing"

const size = 1000000

type SomeStruct struct {
    ID0 int64
    ID1 int64
    ID2 int64
    ID3 int64
    ID4 int64
    ID5 int64
    ID6 int64
    ID7 int64
    ID8 int64
}

func BenchmarkForVar(b *testing.B) {
    slice := make([]SomeStruct, size)
    b.ReportAllocs()
    b.ResetTimer()
    for i := 0; i < b.N; i++ {
        for _, s := range slice { // index and value
            _ = s
        }
    }
}
func BenchmarkForCounter(b *testing.B) {
    slice := make([]SomeStruct, size)
    b.ReportAllocs()
    b.ResetTimer()
    for i := 0; i < b.N; i++ {
        for i := range slice { // only use the index
            s := slice[i]
            _ = s
        }
    }
}
基准测试结果
$ go test -bench .
goos: linux
goarch: amd64
BenchmarkForVar-4               4363        269711 ns/op           0 B/op           0 allocs/op
BenchmarkForCounter-4           4195        285952 ns/op           0 B/op           0 allocs/op
PASS
ok      _/test1    2.685s
并没有太大差异,但是当我们稍微改一下SomeStruct结构
type SomeStruct struct {
    ID0 int64
    ID1 int64
    ID2 int64
    ID3 int64
    ID4 int64
    ID5 int64
    ID6 int64
    ID7 int64
    ID8 int64
    ID9 int64
}
再进行基准测试
$ go test -bench .
goos: linux
goarch: amd64
BenchmarkForVar-4                282       4264872 ns/op           0 B/op           0 allocs/op
BenchmarkForCounter-4           4363        269761 ns/op           0 B/op           0 allocs/op
PASS
ok      _/test1    3.255s
为什么?问题大概是出在range上,看下汇编。
为了容易看汇编,我们搞一个main.go
package main

func main() {
    const size = 1000000

    slice := make([]SomeStruct, size)
    for _, s := range slice {
        _ = s
    }
}
go tool compile -S main.go type.go | grep -v FUNCDATA | grep -v PCDATA
第一个版本的SomeStruct
"".main STEXT size=93 args=0x0 locals=0x28
    ...
    0x0024 00036 (main_var.go:6)    MOVQ    AX, (SP)
    0x0028 00040 (main_var.go:6)    MOVQ    $1000000, 8(SP)
    0x0031 00049 (main_var.go:6)    MOVQ    $1000000, 16(SP)
    0x003a 00058 (main_var.go:6)    CALL    runtime.makeslice(SB)
    0x003f 00063 (main_var.go:6)    XORL    AX, AX       # set AX = 0
    0x0041 00065 (main_var.go:7)    INCQ    AX           # AX++
    0x0044 00068 (main_var.go:7)    CMPQ    AX, $1000000 # AX < 1000000
    0x004a 00074 (main_var.go:7)    JLT    65               # LOOP
    ...
第二个版本
0x0000 00000 (main_var.go:3)    TEXT    "".main(SB), ABIInternal, $120-0
    ...
    0x0044 00068 (main_var.go:6)    XORL    CX, CX # CX = 0
    0x0046 00070 (main_var.go:7)    JMP    76
    0x0048 00072 (main_var.go:7)    ADDQ    $80, AX
    0x004c 00076 (main_var.go:7)    PCDATA    $0, $2 # setup temporary variable autotmp_7
    0x004c 00076 (main_var.go:7)    LEAQ    ""..autotmp_7+32(SP), DI
    0x0051 00081 (main_var.go:7)    PCDATA    $0, $3
    0x0051 00081 (main_var.go:7)    MOVQ    AX, SI
    0x0054 00084 (main_var.go:7)    PCDATA    $0, $1
    0x0054 00084 (main_var.go:7)    DUFFCOPY    $826 # copy content of the struct
    0x0067 00103 (main_var.go:7)    INCQ    CX
    0x006a 00106 (main_var.go:7)    CMPQ    CX, $1000000
    0x0071 00113 (main_var.go:7)    JLT    72
    ...
明显看到多了一个DUFFCOPY,其实压根都不用思考就知道是这边的问题了。
当然也可以看下SSA
GOSSAFUNC=main go tool compile -S main_var.go type_small.go
对比两个ssa
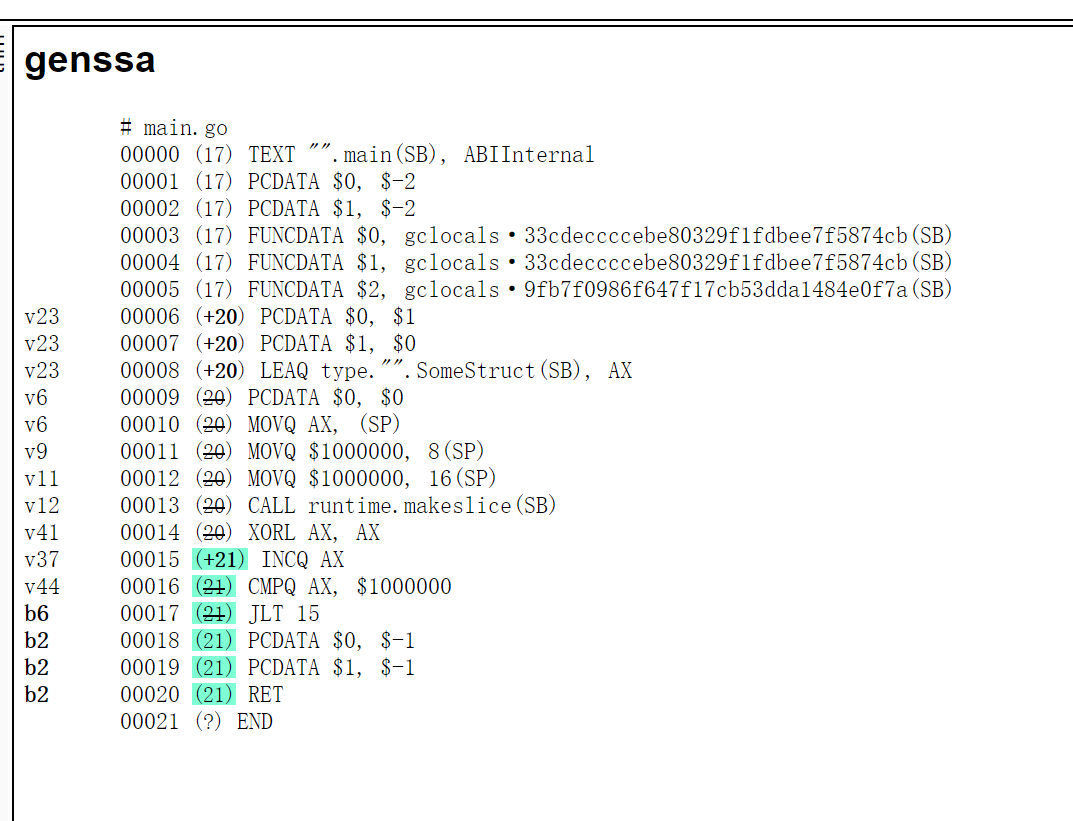
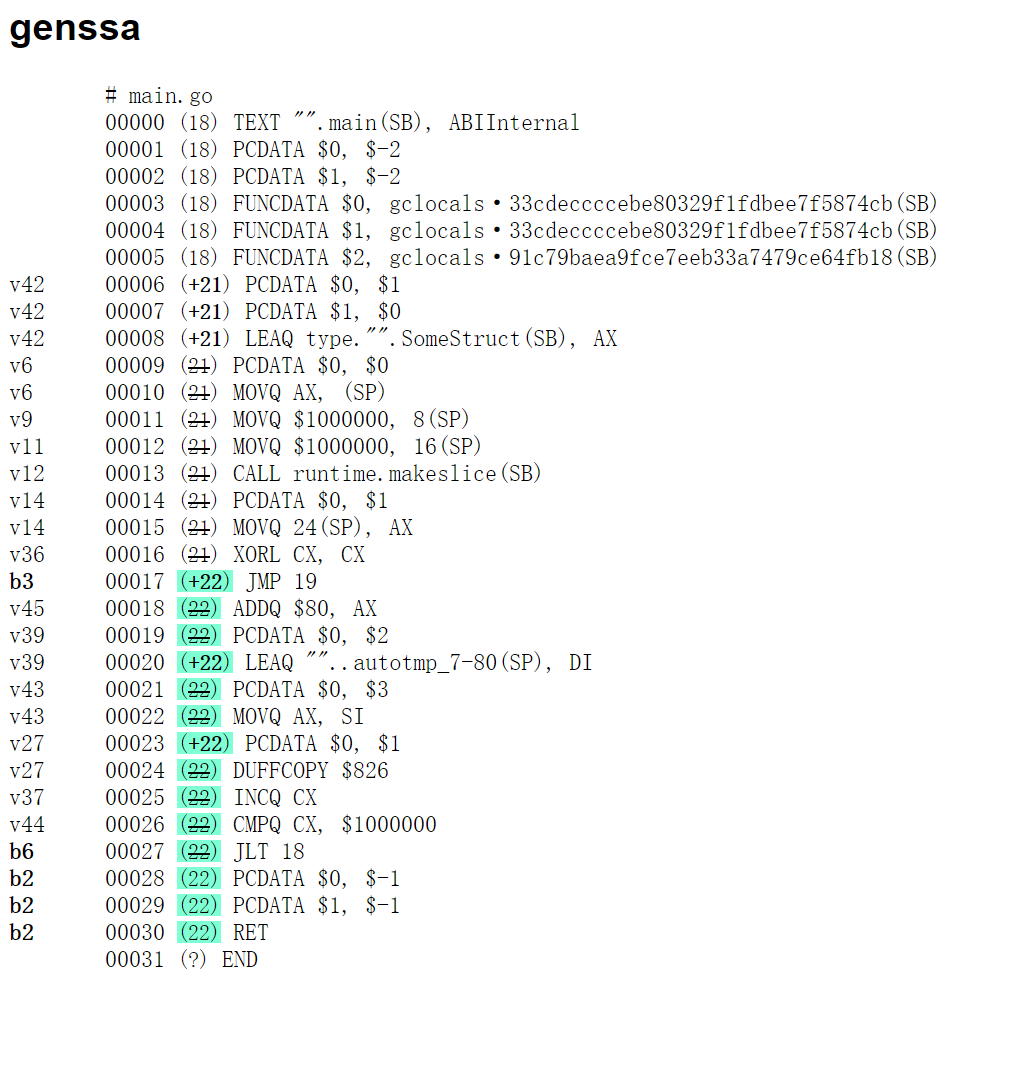
你说咋优化呢,附上俩
    for i := 0; i < b.N; i++ {
        for i := range slice { // only use the index
            s := slice[i]
            _ = s
        }
    }
        for i := 0; i < len(slice); i++ {
            s := slice[i]
            _ = s
        }
一般情况我们不会单独测,都是性能测试,比如pprof trace这类
When profiling my app, and run top, I see
Showing top 10 nodes out of 31 (cum >= 0.12s)
      flat  flat%   sum%        cum   cum%
    13.93s 63.00% 63.00%     13.93s 63.00%  runtime.duffcopy


end
一个没有高级趣味的人。
email:hushui502@gmail.com
