Windows本地搭建JVM监控
Windows本地搭建JVM监控
-
请详细查看上一篇文章<<Windows本地搭建MySQL监控>>,因为流程大多数都是重复的,笔者在此不想再次叙述。
-
本文学习自B站Up 美年达分达,搭建此监控需要以下三个软件。
- Prometheus
- Garfana_enterprise
-
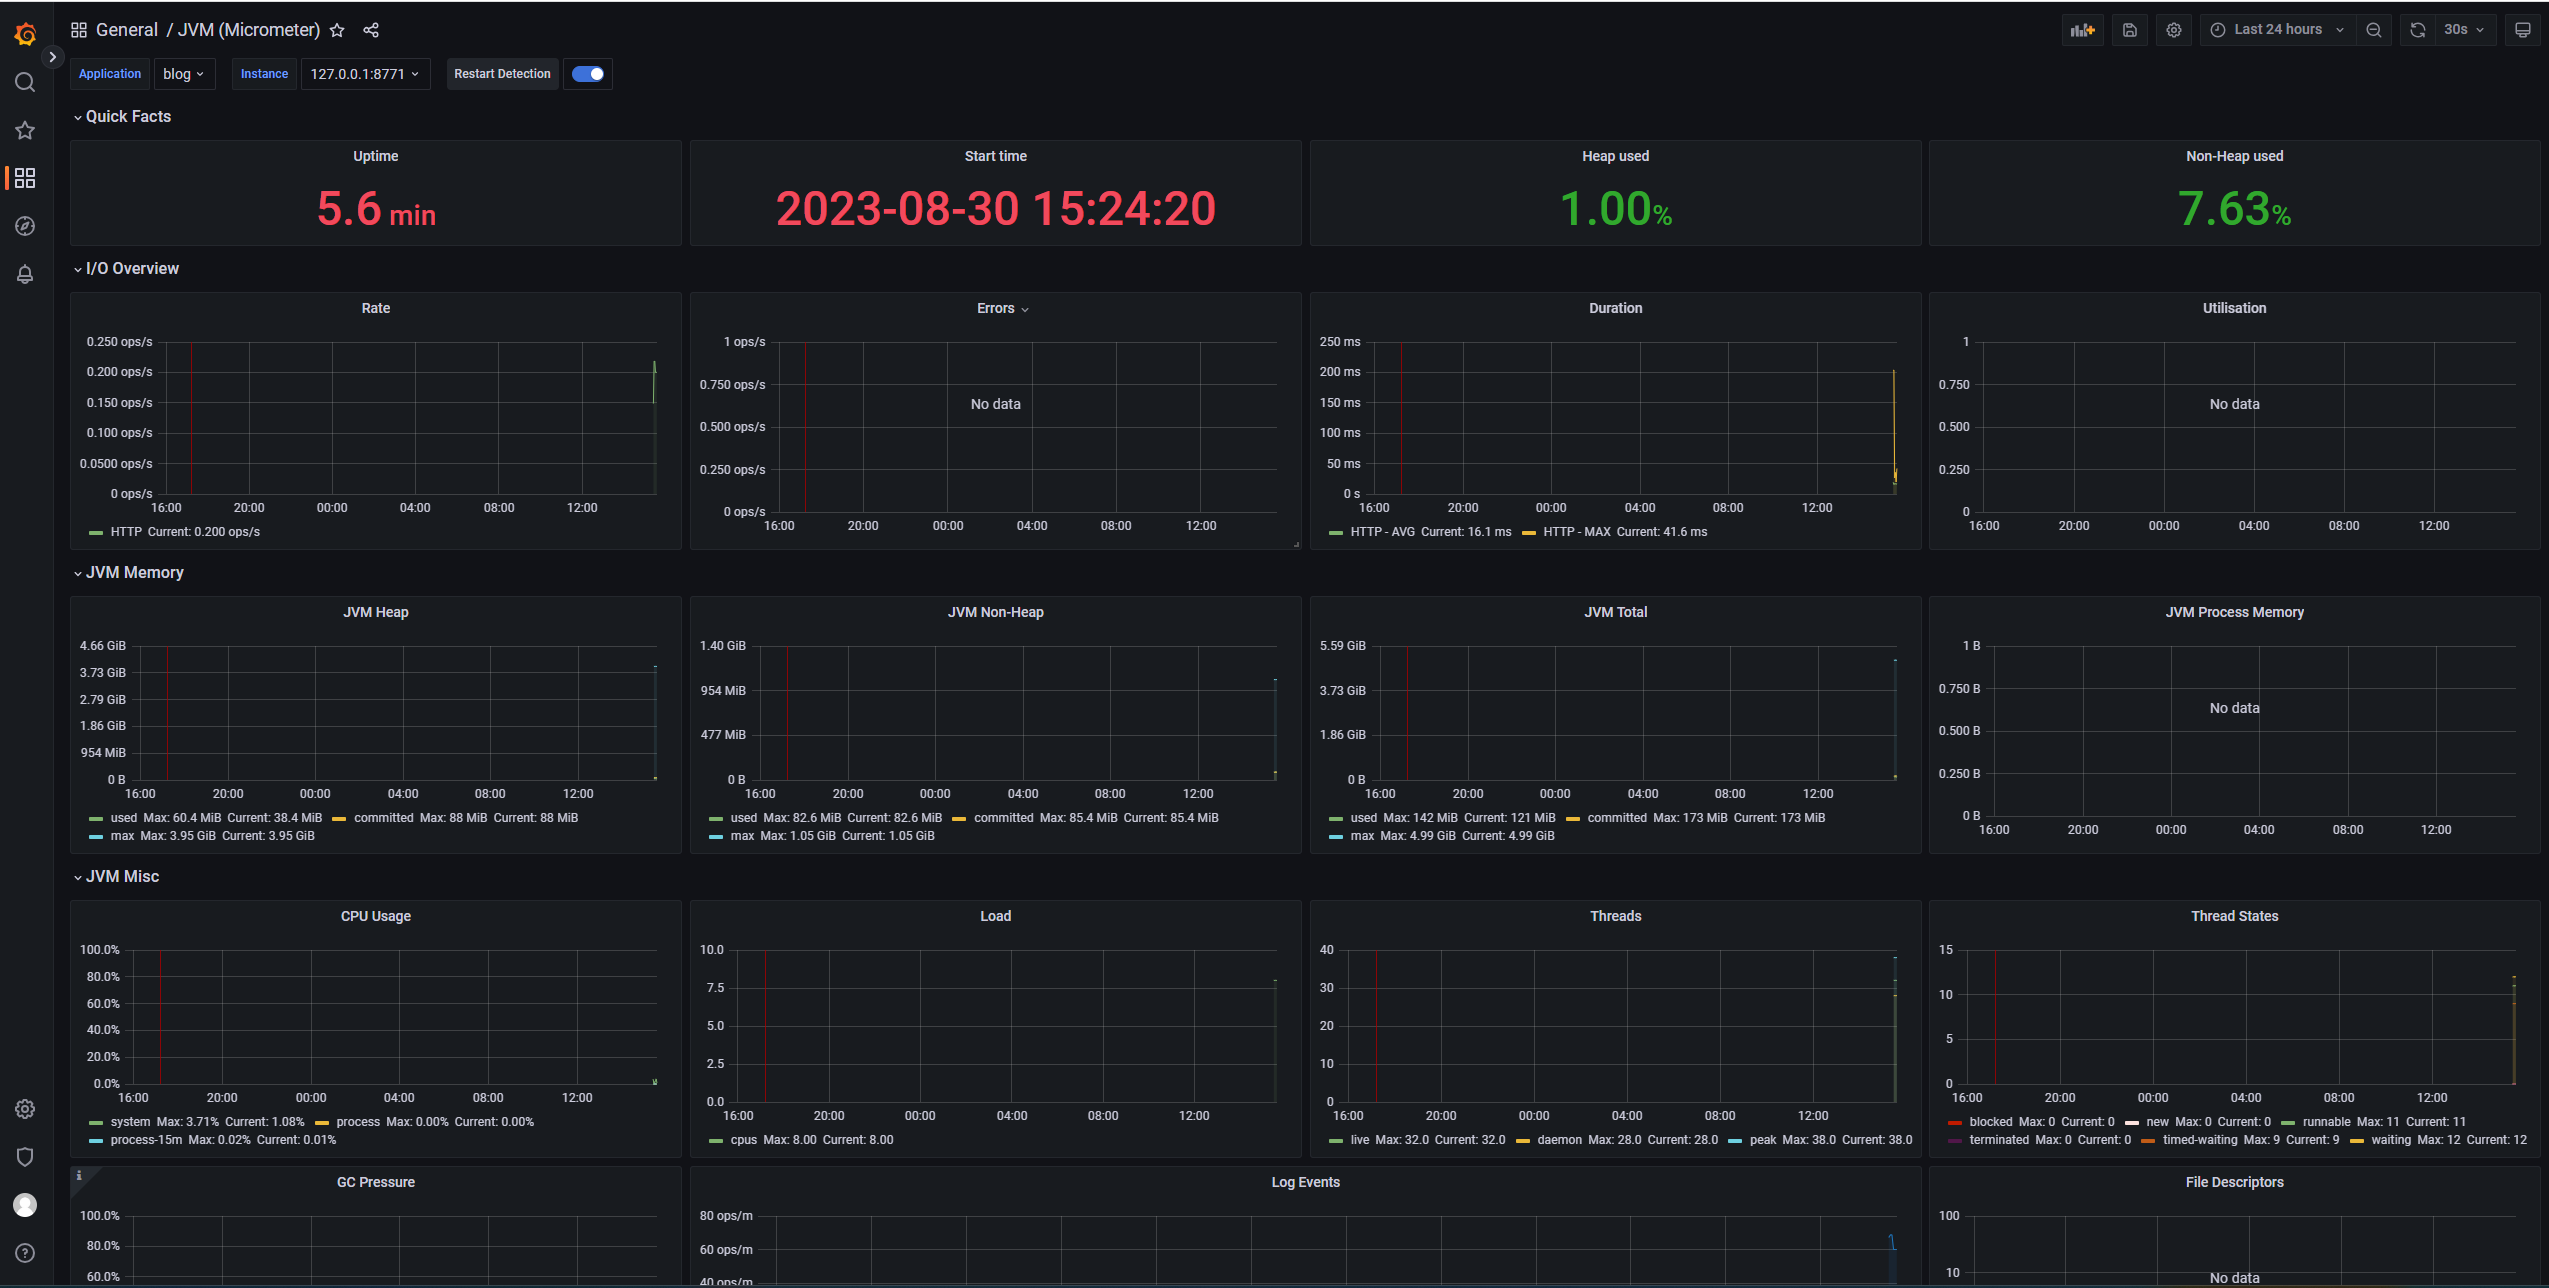
JVM监控效果图
SpringBoot
Maven依赖
<dependency>
    <groupId>org.springframework.boot</groupId>
    <artifactId>spring-boot-starter-actuator</artifactId>
</dependency>
<dependency>
    <groupId>io.micrometer</groupId>
    <artifactId>micrometer-registry-prometheus</artifactId>
</dependency>
SpringBoot配置文件
- ${spring.application.name} : 读取配置文件中的项目名,没有就配置一下,不会就百度。
management:
  endpoints:
    web:
      exposure:
        include: '*'
  metrics:
    tags:
      application: ${spring.application.name}
SpringBoot配置类
@Bean
public MeterRegistryCustomizer<MeterRegistry> configurer(@Value("${spring.application.name}") String applicationName) {
    return registry -> registry.config().commonTags("application", applicationName);
}
启动springboot项目
-
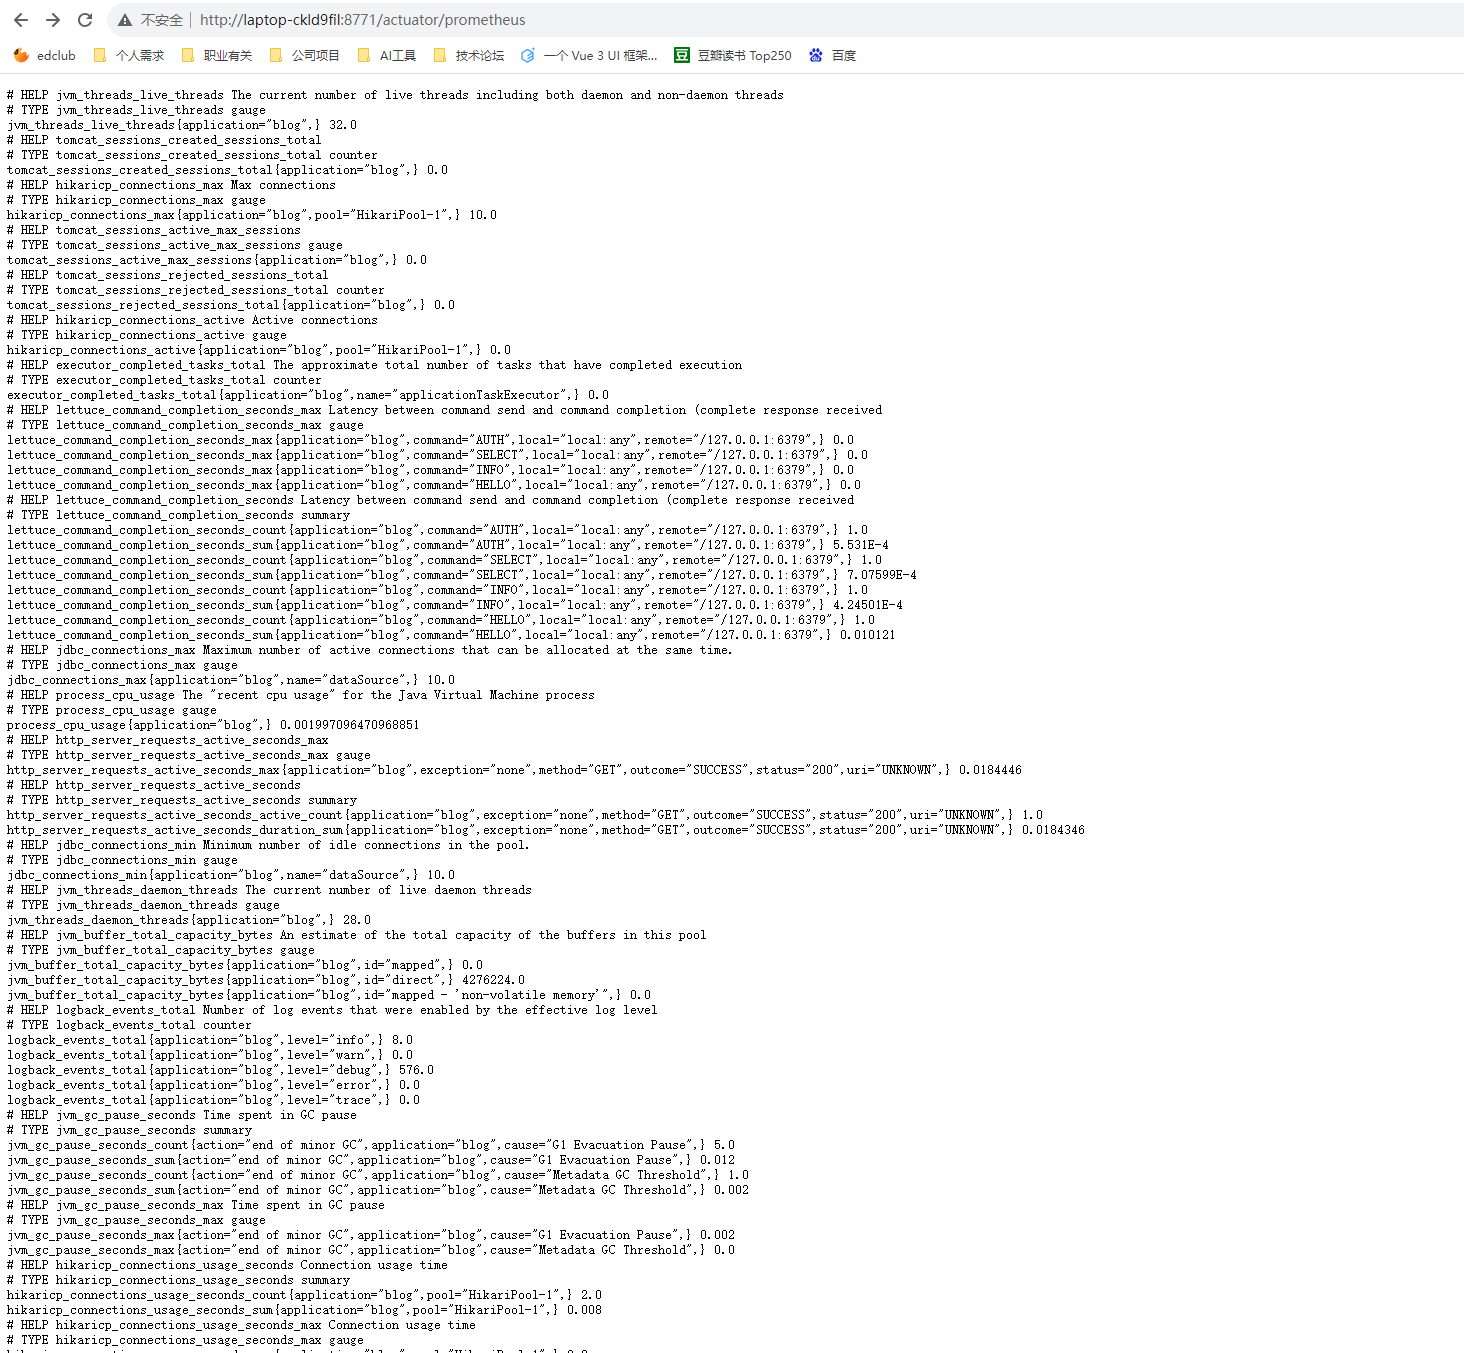
访问http://laptop-ckld9fil:8771/actuator/prometheus,确保是否抓取到信息指标
-
如有权限框架和配置过滤器拦截器之类的,要加上路径放行
Prometheus
- 添加Prometheus配置,此处的static_configs属性一定是你SpringBoot项目的地址。
  - job_name: "Local_jvm"
    # 多久采集一次数据
    scrape_interval: 5s
    # 采集时的超时时间
    scrape_timeout: 5s
    # 采集的路径
    metrics_path: '/actuator/prometheus'
    # 采集Springboot服务的地址
    static_configs:
      - targets: ['127.0.0.1:8771']
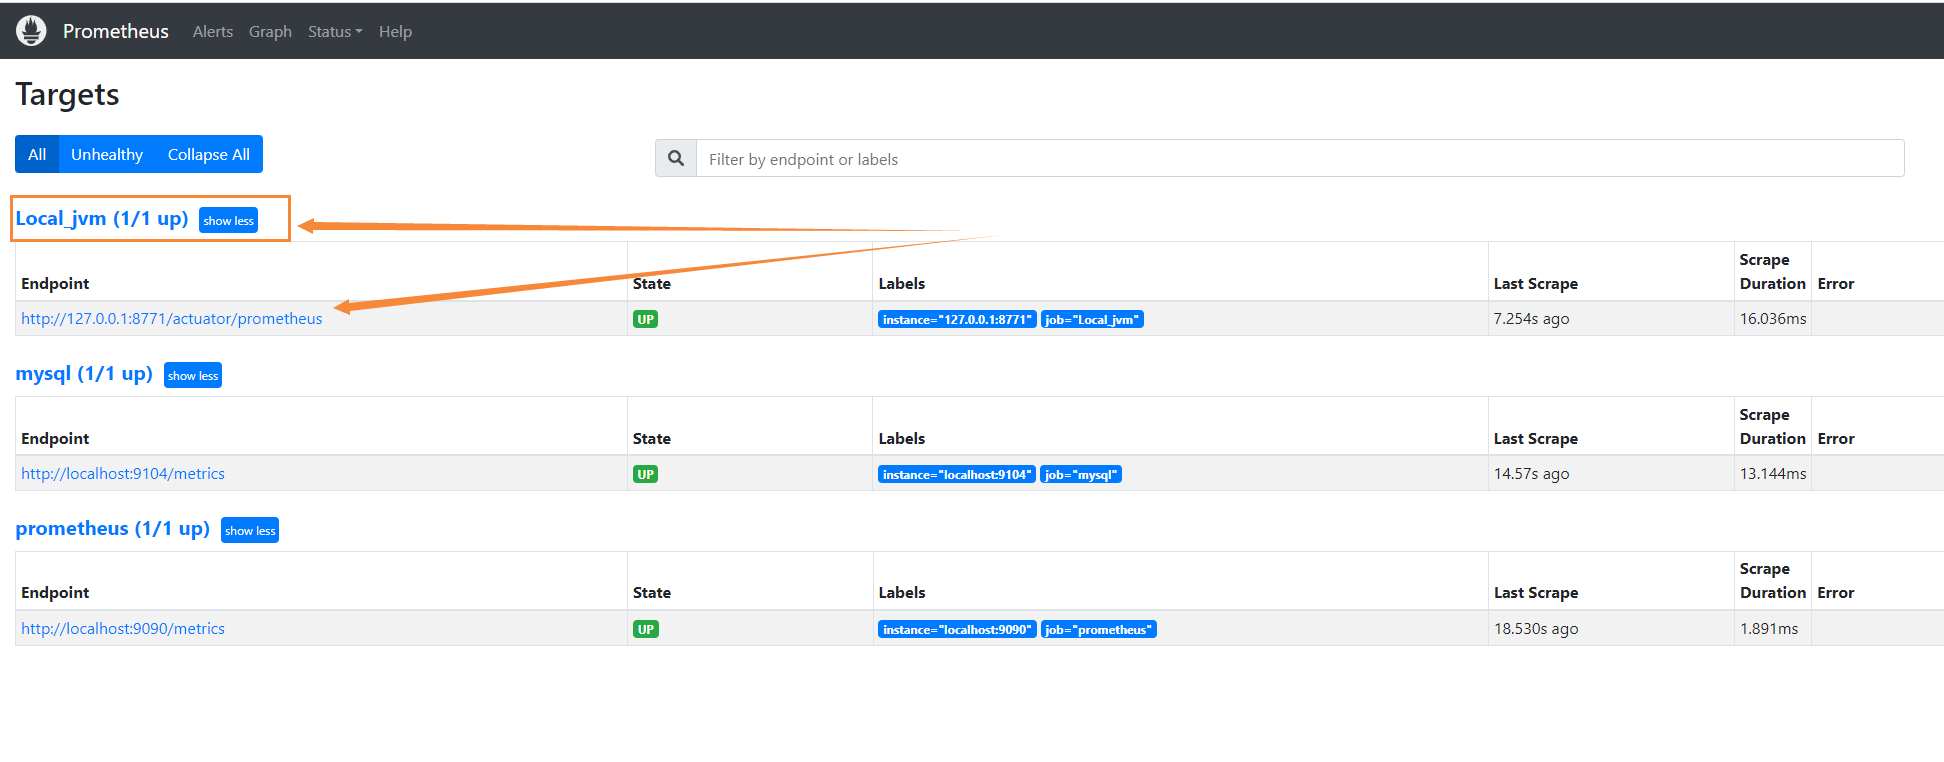
访问Prometheus
- 修改完配置文件后,要重启Prometheus
Grafana
-
关于Grafana的模板添加,笔者实在不想再写一遍,请参看<<Windows本地搭建MySQL监控>>中的Grafana笔记。
-
如有时间且会经常使用此功能的读者,笔者在此提供Grafana地址,请自行获取,毕竟适合自己审美的才能看得舒心。
-
有什么问题可以联系给笔者发送邮件或者直接在文章顶部查看原作者视频

 浙公网安备 33010602011771号