ECharts动态实现柱状图和折线图
ECharts动态实现柱状图和折线图
ECharts官网
https://echarts.apache.org/zh/index.html
动态生成柱状图
ECharts柱状图前台代码
        //引用相关文件
        <script src="~/js/jquery.min.js"></script>
        <script src="~/lib/echarts/dist/echarts.min.js"></script>
        //div
        <div id="main" style="width: 100%;height:100%;"></div>
JS代码
            <script type="text/javascript">


        //$.get('/api/EChartsApi/getBarAndLineData', function (result) {
        //    for (var i = 0; i < result.data.length; i++) {
        //        Month.push(result.data[i].TypeName.toString());
        //        //console.log(result.data[i].TypeName.toString());
        //    }
        //    console.log(Month);
        //})
        var Month = [];//月份
        var TypeName = [];//类型

        var BarAndLineData = [];//数据源
        $.ajax({
            type: 'get',
            url: '/api/EChartsApi/getBarAndLineMonth',
            async: false,
            success: function (monthResult) {

                //x轴月份赋值
                for (var i = 0; i < monthResult.data.length; i++) {
                    Month.push(monthResult.data[i].month.toString());
                }

                $.ajax({
                    type: 'get',
                    url: '/api/EChartsApi/getBarAndLineTypeName',
                    async: false,
                    success: function (TypeNameResult) {
                        for (var i = 0; i < TypeNameResult.data.length; i++) {
                            //类型赋值
                            TypeName.push(TypeNameResult.data[i].TypeName.toString());
                        }
                    }
                })

                for (var i = 0; i < TypeName.length; i++)
                {
                    //单个月份值
                    var Num = [];
                    $.ajax({
                        type: 'post',
                        data: { TypeName: TypeName[i].toString() },
                        url: '/api/EChartsApi/postBarAndLineNum',
                        async: false,
                        success: function (NumResult) {
                            for (var i = 0; i < NumResult.data.length; i++) {
                                //单个月份的数值赋值
                                Num.push(NumResult.data[i].Num.toString());
                            };
                        }
                    })
                    //存储数据源
                    var TypeNameT = {
                        name: TypeName[i].toString(),
                        type: TypeName[i].toString() == '温度' ? 'line' : 'bar',
                        yAxisIndex: TypeName[i].toString() == '温度' ? 1 : 0,
                        data: Num,
                        label: {
                            normal: {
                                show: true,
                                position: 'top',
                                textStyle: {
                                    color: 'black'
                                }
                            }
                        },
                    };
                    //赋值数据源
                    BarAndLineData.push(TypeNameT);
                }
                //var TypeNameT = {
                //    name: '降水量',
                //    type: 'bar',
                //    data: [10, 20, 30]
                //};
                //TypeName.push(TypeNameT);
            }
        })

        var y1Max;//温度
        var y2Max;//毫升
        $.ajax({
            type: 'get',
            url: '/api/EChartsApi/getBarAndLineMax',
            async: false,
            success: function (MaxNum) {
                y1Max = MaxNum.data[0].Num;
                y2Max = MaxNum.data[1].Num;
            }
        })

        // 基于准备好的dom,初始化echarts实例
        var myChart = echarts.init(document.getElementById('main'));

        // 指定图表的配置项和数据
        var option = {
            title: {
                left: 'center',
                text: '天气图',
            },//标题
            tooltip: {
                trigger: 'axis',
                axisPointer: {
                    type: 'cross',
                    crossStyle: {
                        color: '#999'
                    }
                }
                //, formatter: '{a} <br/>{b} : {c} ({d}%)' //自定义显示格式
            },//鼠标移入显示
            toolbox: {
                feature: {
                    dataView: { show: true, readOnly: false },
                    magicType: { show: true, type: ['line', 'bar'] },
                    restore: { show: true },
                    saveAsImage: { show: true }
                }
            },//工具栏
            legend: {
                //data: ['蒸发量', '降水量', '平均温度'],
                top: '30',
                //orient: 'vertical',
            },//标签属性
            xAxis: [
                {
                    type: 'category',
                    data: Month,//['1月', '2月', '3月', '4月', '5月', '6月', '7月', '8月', '9月', '10月', '11月', '12月'],
                    axisPointer: {
                        type: 'shadow'
                    }
                }
            ],//X轴
            yAxis: [
                {
                    type: 'value',
                    name: '水量',
                    min: 0,
                    max: 500,//y2Max,
                    interval: 50,
                    axisLabel: {
                        formatter: '{value} ml'
                    }
                },
                {
                    type: 'value',
                    name: '温度',
                    min: 0,
                    max: 50,//y1Max,
                    interval: 5,
                    axisLabel: {
                        formatter: '{value} °C'
                    }
                }
            ],//Y轴
            series: BarAndLineData
            //[
            //{
            //    name: '蒸发量',
            //    type: 'bar',
            //    data: [2.0, 4.9, 7.0, 23.2, 25.6, 76.7, 135.6, 162.2, 32.6, 20.0, 6.4, 3.3],
            //    itemStyle: {
            //        normal: {
            //            color: '#AFEEEE'
            //        }
            //    },
            //label: {
            //    normal: {
            //        show: true,
            //        position: 'top',
            //        textStyle: {
            //            color: 'black'
            //        }
            //    }
            //}
            //},
            //{
            //    name: '降水量',
            //    type: 'bar',
            //    data: [2.6, 5.9, 9.0, 26.4, 28.7, 70.7, 175.6, 182.2, 48.7, 18.8, 6.0, 2.3],
            //    itemStyle: {
            //        normal: {
            //            color: '#7FFFAA'
            //        }
            //    },
            //    label: {
            //        normal: {
            //            show: true,
            //            position: 'top',
            //            textStyle: {
            //                color: 'black'
            //            }
            //        }
            //    }

            //},
            //{
            //    name: '平均温度',
            //    type: 'line',
            //    yAxisIndex: 1,
            //    data: [2.0, 2.2, 3.3, 4.5, 6.3, 10.2, 20.3, 23.4, 23.0, 16.5, 12.0, 6.2],
            //    itemStyle: {
            //        normal: {
            //            color: '#FFA07A'
            //        }
            //    },
            //    label: {
            //        normal: {
            //            show: true,
            //            position: 'top',
            //            textStyle: {
            //                color: 'black'
            //            }
            //        }
            //    }
            //}
            //]
        };

        // 使用刚指定的配置项和数据显示图表。
        myChart.setOption(option);

    </script>
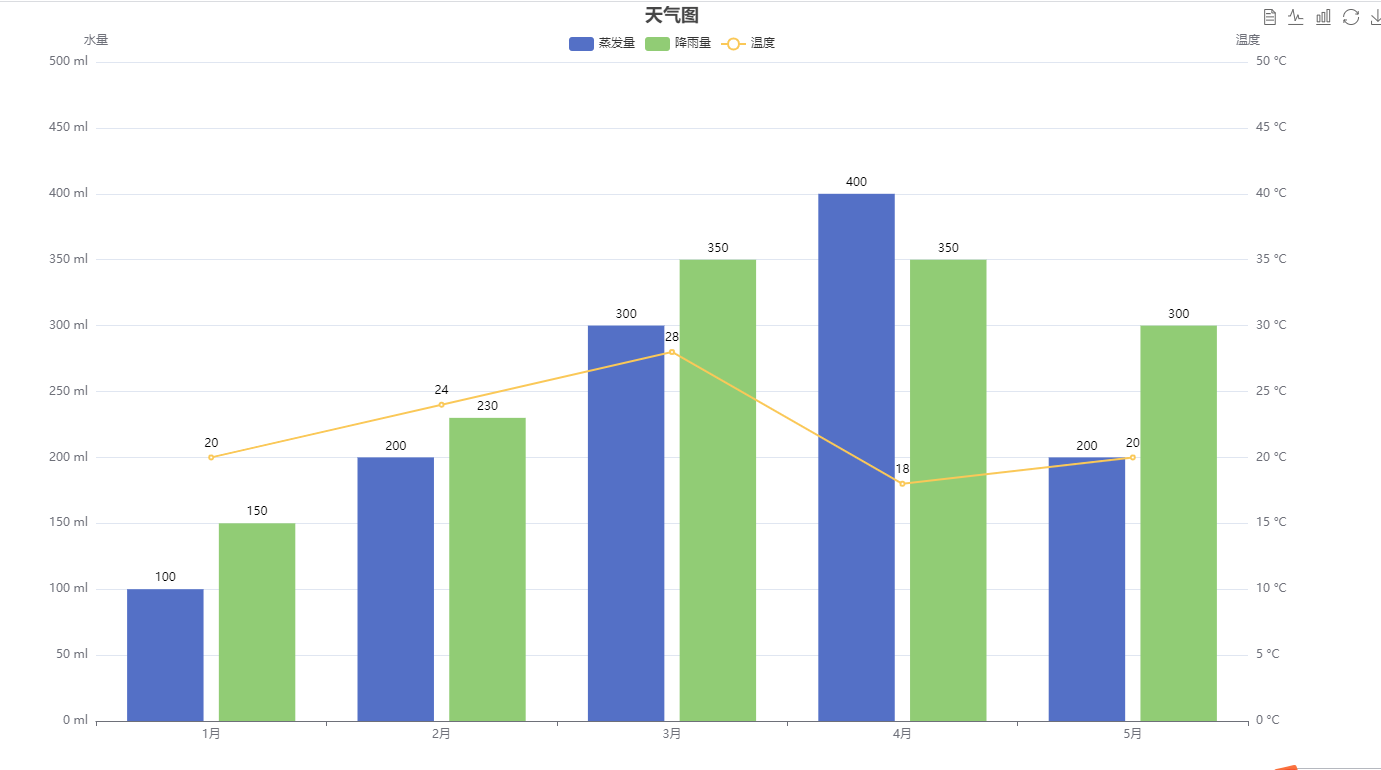
实现效果如下

 浙公网安备 33010602011771号