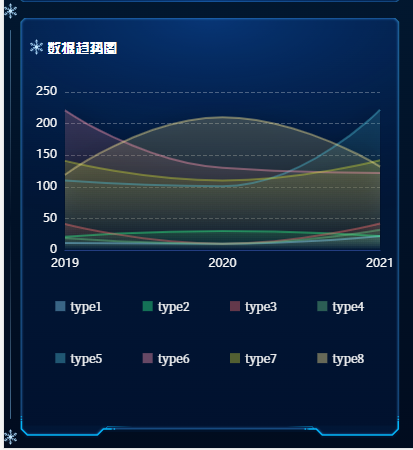

<template>
  <div
    ref="echartsBox"
    class="chart"
    :style="{ height: height, width: width }"
  />
</template>

<script>
import * as echarts from "echarts";
import { echartAnimation } from "@/utils/index";
export default {
  name: "LineMore",
  props: {
    width: {
      type: String,
      default: "100%",
    },
    height: {
      type: String,
      default: "100%",
    },
    barColor: {
      type: String,
      default: "#FF9129",
    },
    lineColor: {
      type: Array,
      default: () => {
        return ["#8BDCFF", "#2FFC8C"];
      },
    },
    title: {
      type: String,
      default: "",
    },
    tooltips: {
      type: String,
      default: "",
    },
    isSmooth: {
      type: Boolean,
      default: false,
    },
    animation: {
      type: Boolean,
      default: false,
    },
    size: {
      type: Number,
      default: null,
    },
    toolSize: {
      type: Number,
      default: null,
    },
    /*
      [[曲线名称],[x轴],[[曲线1数据],[曲线2数据],[曲线3数据]]]
    */
    dataList: {
      type: Array,
      default: () => {
        return [
          [
            "type1",
            "type2",
            "type3",
            "type4",
            "type5",
            "type6",
            "type7",
            "type8",
          ],
          [2019, 2020, 2021],
          [
            [11, 10, 22],
            [21, 30, 22],
            [41, 10, 42],
            [19, 10, 32],
            [110, 101, 222],
            [221, 130, 122],
            [141, 110, 142],
            [119, 210, 132],
          ],
        ];
      },
    },

    grid: {
      type: Object,
      default: () => {
        return {};
      },
    },
  },
  data() {
    return {
      chart: null,
      fontSize: 1,
      barWidth: 16,
    };
  },
  watch: {
    dataList: {
      handler() {
        this.initChart();
      },
      deep: true,
    },
  },
  beforeDestroy() {
    if (!this.chart) {
      return;
    }
    this.chart.dispose();
    this.chart = null;
  },
  created() {},
  mounted() {
    if (this.dataList.length > 0) {
      this.initChart();
    }
  },
  methods: {
    cDispose() {
      this.chart.dispose();
      this.chart = null;
    },
    colorRgba(sHex, alpha = 1) {
      var reg = /^#([0-9a-fA-f]{3}|[0-9a-fA-f]{6})$/;
      let sColor = sHex.toLowerCase();
      if (sColor && reg.test(sColor)) {
        if (sColor.length === 4) {
          var sColorNew = "#";
          for (let i = 1; i < 4; i += 1) {
            sColorNew += sColor.slice(i, i + 1).concat(sColor.slice(i, i + 1));
          }
          sColor = sColorNew;
        }
        var sColorChange = [];
        for (let i = 1; i < 7; i += 2) {
          sColorChange.push(parseInt("0x" + sColor.slice(i, i + 2)));
        }
        return "rgba(" + sColorChange.join(",") + "," + alpha + ")";
      } else {
        return sColor;
      }
    },
    initChart() {
      this.chart = echarts.init(this.$el, "macarons");
      this.setOption();
    },
    setOption() {
      const _this = this;
      const fontColor = "#F7F7F7";
      const grid = Object.assign(
        {},
        {
          left: 45 * _this.fontSize,
          right: 20 * _this.fontSize,
          top: 30 * _this.fontSize,
          bottom: 40 * _this.fontSize,
        },
        this.grid
      );
      let colorList = [
        "#F66D6F",
        "#68CB86",
        "#4DBFD8",
        "#FF99B3",
        "#CAD335",
        "#FFEB94",
        "#F37C5A",
        "#86B55C",
        "#753174",
        "#DA7FCC",
      ];
      colorList = [..._this.lineColor, ...colorList];
      const [..._temp] = _this.dataList || [];
      const [_type, xData, sData] = [..._temp];

      const dataSeries = [];
      const animationSeries = [];

      sData.forEach(function (item, i, arr) {
        animationSeries.push({
          type: "lines",
          coordinateSystem: "cartesian2d",
          zlevel: 1,
          smooth: true,
          symbol: "circle",
          effect: {
            show: true,
            smooth: true,
            period: 2,
            symbolSize: 4,
          },
          lineStyle: {
            normal: {
              color: colorList[i],
              width: 0,
              opacity: 0,
              curveness: 0,
            },
          },
          data: echartAnimation([xData, item]),
        });
        dataSeries.push({
          name: _type[i],
          type: "line",
          yAxisIndex: 0,
          smooth: _this.isSmooth,
          showSymbol: false, //显示圆圈
          showAllSymbol: false,
          data: item,
          itemStyle: {
            color: _this.colorRgba(colorList[i], 0.4),
          },
          areaStyle: {
            normal: {
              color: new echarts.graphic.LinearGradient(
                0,
                0,
                0,
                1,
                [
                  {
                    offset: 0,
                    color: _this.colorRgba(colorList[i], 0.3), // 'rgba(0,212,255, 0.5)',
                  },
                  {
                    offset: 1,
                    color: _this.colorRgba(colorList[i], 0), // 'rgba(0,212,255, 0)'
                  },
                ],
                false
              ),
              shadowBlur: 20,
            },
          },
        });
      });

      const units = {};

      const option = {
        grid: grid,
        legend: {
          icon: "rect",
          top: "62%",
          left: "center",
          itemWidth: 10,
          itemHeight: 10,
          itemGap: 40,
          textStyle: {
            color: fontColor,
            fontSize: 12,
            fontFamily: "SourceHanSerifCN-Regular",
          },
        },
        tooltip: {
          show: true,
          trigger: "axis",
          confine: true,
          textStyle: {
            fontSize: this.toolSize ? this.toolSize : "inherit",
          },
          formatter(params) {
            return `<div>
            <p class="tooltip-title">${params[0].name}</p>
            ${_this.$pubFun.tooltipItemsHtmlString(params)}
          </div>`;
          },
          className: "echarts-tooltip-diy",
        },
        xAxis: {
          type: "category",
          data: xData,
          boundaryGap: false,
          splitLine: {
            show: false,
            lineStyle: {
              color: "#203A6F",
              width: 1,
            },
          },
          axisLine: {
            lineStyle: {
              color: "#233D80",
            },
          },
          axisTick: {
            show: false,
          },
          axisLabel: {
            interval: 0,
            color: fontColor,
            fontSize: this.size ? this.size : "inherit",
          },
        },
        dataZoom: [
          {
            show: xData.length > 24,
            type: "slider",
            realtime: true,
            startValue: 0,
            endValue: 5,
            xAxisIndex: [0],
            bottom: "10",
            left: "50",
            height: 2,
            borderColor: "#07417a",
            backgroundColor: "transparent",
            textStyle: {
              color: "#05D5FF",
            },
          },
        ],
        yAxis: [
          {
            type: "value",
            // name: nameaa[0],
            // min: 0,
            // splitNumber: 5,
            // interval: Math.ceil(Math.ceil(Math.max(...sData[0])) / 5),
            // max: Math.ceil(Math.ceil(Math.max(...sData[0])) / 5) * 5,
            splitLine: {
              show: true,
              lineStyle: {
                color: "rgba(243, 244, 244, 0.3)",
                type: "dashed",
              },
            },
            axisLine: {
              lineStyle: {
                color: "#233D80",
              },
            },
            axisTick: {
              show: false,
            },
            axisLabel: {
              show: true,
              color: fontColor,
              fontSize: this.size ? this.size : "inherit",
            },
          },
        ],
        series: _this.animation
          ? [...dataSeries, ...animationSeries]
          : dataSeries,
      };
      this.chart.setOption(option);
    },
  },
};
</script>

<style lang="scss" scoped>
.chart {
  height: 100%;
  width: 100%;
}
</style>


【推荐】国内首个AI IDE,深度理解中文开发场景,立即下载体验Trae
【推荐】编程新体验,更懂你的AI,立即体验豆包MarsCode编程助手
【推荐】抖音旗下AI助手豆包,你的智能百科全书,全免费不限次数
【推荐】轻量又高性能的 SSH 工具 IShell:AI 加持,快人一步
· TypeScript + Deepseek 打造卜卦网站:技术与玄学的结合
· Manus的开源复刻OpenManus初探
· 三行代码完成国际化适配,妙~啊~
· .NET Core 中如何实现缓存的预热?
· 如何调用 DeepSeek 的自然语言处理 API 接口并集成到在线客服系统
2019-10-18 vue 分组左右选择
2018-10-18 js 去掉数组对象中的重复对象
2017-10-18 js excel 列表导出
2017-10-18 js 两个日期比较相差多少天
2017-10-18 js 比较两个日期的大小