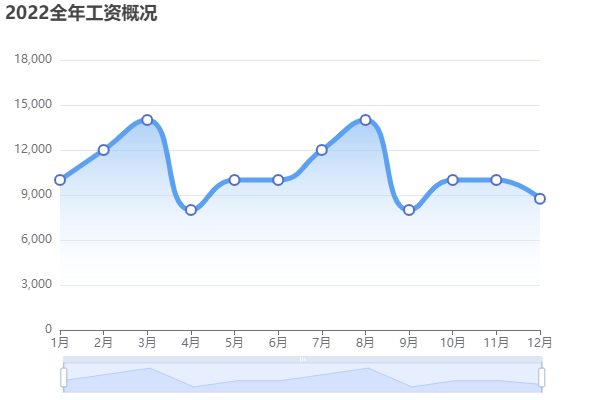
简单的可视化图表——“折线图”
ECharts折线图
基础模板参考:https://echarts.apache.org/handbook/zh/get-started/
例图:

下附简单代码:
var option = {
    // 鼠标移入
    tooltip: {
        trigger: 'axis',
        position: function (pt) {
            return [pt[0], '10%'];
        }
    },
    // 标题
    title: {
        left: 'left',
        text: '2022全年工资概况'
    },
    // 工具箱
    toolbox: {
        feature: {
            dataZoom: {
                yAxisIndex: 'none'
            },
            restore: {},
            saveAsImage: {}
        }
    },
    // x轴数据
    xAxis: {
        type: 'category',
        boundaryGap: false,
        data: [
            '1月',
            '2月',
            '3月',
            '4月',
            '5月',
            '6月',
            '7月',
            '8月',
            '9月',
            '10月',
            '11月',
            '12月'
        ]
    },
    // y轴数据
    yAxis: {
        type: 'value',
        boundaryGap: [0, '50%']
    },
    // 底部拉条
    dataZoom: [
        {
            type: 'inside',
            start: 0,
            end: 100
        },
        {
            start: 0,
            end: 10
        },
    ],
    // 线条内容
    series: [
        {
            name: '学科薪资', // 提示内容
            type: 'line',
            smooth: true, //设置曲线
            symbolSize: 10, // 小圆圈大小
            // 默认空心圆
            // symbol: 'circle',
            sampling: 'lttb',
            // 线条样式
            lineStyle: {
                width: 5,  // 线条宽度
                color: '#5ca0f1'
            },
            // 图标样式
            areaStyle: {
                color: new echarts.graphic.LinearGradient(0, 0, 0, 1, [
                    {
                        offset: 0,
                        color: '#8bbcf4'
                    },
                    {
                        offset: 0.8,
                        color: 'rgba(255, 255, 255, 0.2)'
                    },
                    {
                        offset: 1,
                        color: '#ffffff'
                    }
                ])
            },
            data: ['10000', '12000', '14000', '8000', '10000', '10000', '12000', '14000', '8000', '10000', '9999', '8752']
        }
    ]
};
本文来自博客园,作者:三井绫子,转载请注明原文链接:https://www.cnblogs.com/Ayako/p/16911855.html


【推荐】国内首个AI IDE,深度理解中文开发场景,立即下载体验Trae
【推荐】编程新体验,更懂你的AI,立即体验豆包MarsCode编程助手
【推荐】抖音旗下AI助手豆包,你的智能百科全书,全免费不限次数
【推荐】轻量又高性能的 SSH 工具 IShell:AI 加持,快人一步