

记录echarts升级echarts5.3.0
转自于:https://zhuanlan.zhihu.com/p/526439319
背景
为更好地维护项目以及使用v5新特性,把已有项目的eharts3.0/4.0升级v5【升级文档】
前期准备
推荐一个npm版本检测工具npm-check,也可用于检测不用npm依赖,减少node_modules体积 安装:
npm install -g npm-check / yarn global add npm-check
使用:
npm-check
查看echarts版本命令
npm info echarts versions / yarn info echarts versions
详细步骤
版本更新方式一
①卸载echarts
yarn remove echarts
②安装指定版本
yarn add echarts@5.3.0
版本更新方式二
①修改package.json
"echarts": "^5.3.0"
②重新装包:yarn
一些配置的改变
①引入改变
低版本:import echarts from 'echarts' / import echarts from 'echarts/lib/echarts';
v5版本:import * as echarts from 'echarts'/ import * as echarts from 'echarts/lib/echarts';
tips:若其它插件也依赖当前echarts,也需按如上方式改写引入
②配置itemStyle、lineStyle
- warning:itemStyle.emphasis has been changed to emphasis.itemStyle since 4.0;
- label.emphasis has been changed to emphasis.label since 4.0
- 大意就是itemStyle.emphasis【设置高亮状态下的多边形和标签样式。】从4.0后改成直接在emphasis里设置itemStyle、label等 旧版本:
旧版本:
   "itemStyle": {
      "normal": {
        "areaColor": "#eeeeee",
        "borderColor": "#999999",
        "borderWidth": "0.5"
      },
    },
新版本:
 "itemStyle": {
        "areaColor": "#eeeeee",
        "borderColor": "#999999",
        "borderWidth": "0.5"
    },
总结:'normal'层次结构已经从4.0移除。现在所有的样式属性都直接在itemStyle、lineStyle中配置。
③emphasis相关
       itemStyle: {
          // normal: {
          areaColor: 'rgba(0, 245,171, 0.3)',
          borderWidth: 2,
          borderColor: '#00F1A9',
          shadowColor: 'rgba(0, 245,171, 0.2)',
          shadowBlur: 6,
          // },
          emphasis: {
            areaColor: 'rgba(0, 245,171, 0.7)',
            borderWidth: 2,
            borderColor: '#00F1A9',
            color: '#fff'
          }
        },
新版本:
        itemStyle: {
          areaColor: 'rgba(0, 245,171, 0.3)',
          borderWidth: 2,
          borderColor: '#00F1A9',
          shadowColor: 'rgba(0, 245,171, 0.2)',
          shadowBlur: 6
        },
        emphasis: {
          itemStyle: {
            areaColor: 'rgba(0, 245,171, 0.7)',
            borderWidth: 2,
            borderColor: '#00F1A9',
            color: '#fff'
          }
        },
④主题相关,针对多主题需求
前言: 可通过主题编辑器定制主题,先抛个官网截图
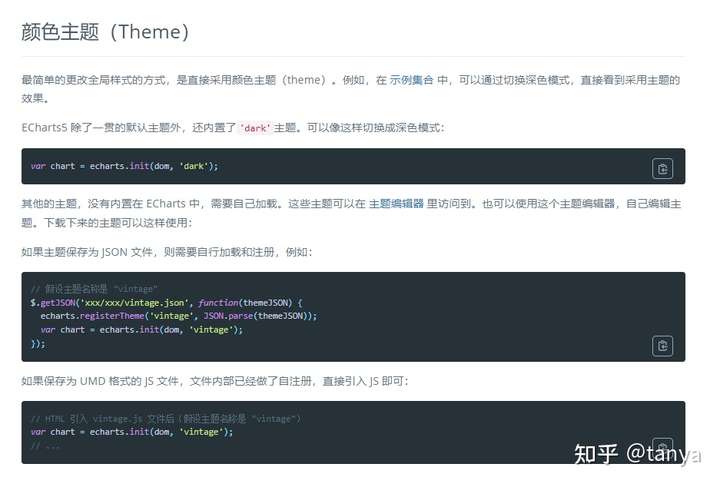
支持两种格式:json和js,用法其实官网已经很详细,以下示例是在vue项目中适用:
①在main.js加载注册主题函数
import * as echarts from 'echarts'
export const initEcharts = async function (theme) {
  //根据自己需要结合cookie或store使用以便切换
  if (!theme) {
    theme = cookieTheme || null
  }
  let themeConfig
  switch (theme) {
    case 'light': {
      const { theme: themeJson } = await import('**.js')
      themeConfig = themeJson
      break
    }
    default: {
      const { theme: themeJson } = await import('**.js')
      themeConfig = themeJson
    }
  }
  echarts.registerTheme(theme, themeConfig)
}
②具体组件使用
async render(data) {
      //重新渲染前先卸载
      if (this.chart != null && this.chart !== '' && this.chart !== undefined) {
        this.chart.dispose()
      }
      this.$nextTick(async () => {
        const theme = getTheme()
        this.chart = echarts.init(this.$refs.bar, theme)
        await this.getOptionData(data)
        const options = this.barChart
        this.chart.setOption(options)
        console.log('options', this.chart.getOption())
      })
}⑤优化性能之按需引入
- 新建一个文件,内容可参考如下:
// 引入 echarts 核心模块,核心模块提供了 echarts 使用必须要的接口。
import * as echarts from 'echarts/core'
// 引入图表,图表后缀都为 Chart
import { BarChart, LineChart, PieChart, MapChart } from 'echarts/charts'
// 引入提示框,标题,直角坐标系,数据集,内置数据转换器等组件,组件后缀都为 Component
import {
  TitleComponent,
  TooltipComponent,
  GridComponent,
  DatasetComponent,
  TransformComponent,
  GeoComponent,
  VisualMapComponent,
  DataZoomComponent,
  LegendComponent,
  MarkAreaComponent
} from 'echarts/components'
// 标签自动布局,全局过渡动画等特性
import { LabelLayout, UniversalTransition } from 'echarts/features'
// 引入 Canvas 渲染器,注意引入 CanvasRenderer 或者 SVGRenderer 是必须的一步
import { CanvasRenderer } from 'echarts/renderers'

// 注册必须的组件
echarts.use([
  TitleComponent,
  TooltipComponent,
  GridComponent,
  DatasetComponent,
  TransformComponent,
  BarChart,
  LabelLayout,
  UniversalTransition,
  CanvasRenderer,
  LineChart,
  PieChart,
  MapChart,
  GeoComponent,
  VisualMapComponent,
  DataZoomComponent,
  LegendComponent,
  MarkAreaComponent
])

export default echarts
- main.js引入
import echarts from '**.js'
//**为自定义属性名
Vue.prototype.** = echarts
- 组件中使用
 this.$nextTick(() => {
        // 引入主题
        const theme = getTheme()
        //**为自定义属性名
        this.chart = this.$**.init(this.$refs.chart, theme)
        const options = this.options
        this.chart.setOption(options)
      })
总结
实践了一下升级v5.0,本次升级主要涉及一些配置写法的改变,还有样式的调整,后续打算逐步加入新特性~
