
[PWA] 3. Devtool
You can debug with chrom dev tool:
1. Use console to debug service worker:

Swith to sw.js context then you can access 'self' object
2. Set breakpoint:
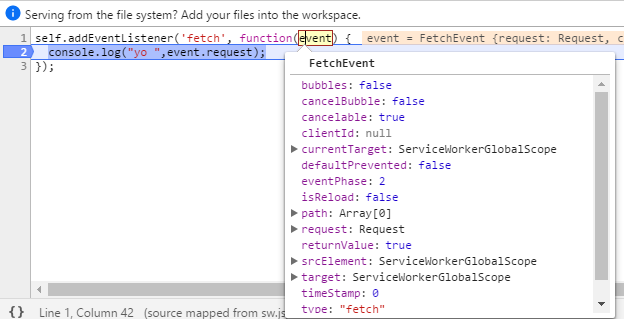
You can see all the event object.
3. You can see the active service worker:

4. Once you change the code, you can see the waiting servie worker:

4. After you close and reopen the page, the waiting service work become the active one.


 浙公网安备 33010602011771号