
[React] Production performance monitoring
We should always ship fast experiences to our users, but sometimes something slips through our PR review process and our users start having a slow experience. Unless they complain to us, we have no way of knowing that things are going so slow for them. User complaints is not a great policy for quality control.
Because we can’t make every user install the React DevTools and profile the app for us as they interact with it, it would be nice if we could somehow track some of the render times and get that information sent to our servers for us to monitor.
Well, the React team has created an API specifically for this. It doesn’t give us quite as much information as the React DevTools do, but it does give us some useful information.
📜 Read up on the capabilities of the <React.Profiler /> component here: https://reactjs.org/docs/profiler.html
// Production performance monitoring
// http://localhost:3000/isolated/exercise/07.js

import React from 'react'
// 🐨 you're going to need the reportProfile function
// 💰 here, let me help you with that...
import reportProfile from '../report-profile'

function Counter() {
  const [count, setCount] = React.useState(0)
  const increment = () => setCount(c => c + 1)
  return <button onClick={increment}>{count}</button>
}

function App() {
  return (
    <div>
      {/*
      🐨 Wrap this div in a React.Profiler component
      give it the ID of "counter" and pass reportProfile
      to the onRender prop.
      */}
      <React.Profiler id="Counter" onRender={reportProfile}>
        <div>
          Profiled counter
          <Counter />
        </div>
      </React.Profiler>

      <div>
        Unprofiled counter
        <Counter />
      </div>
    </div>
  )
}

export default App
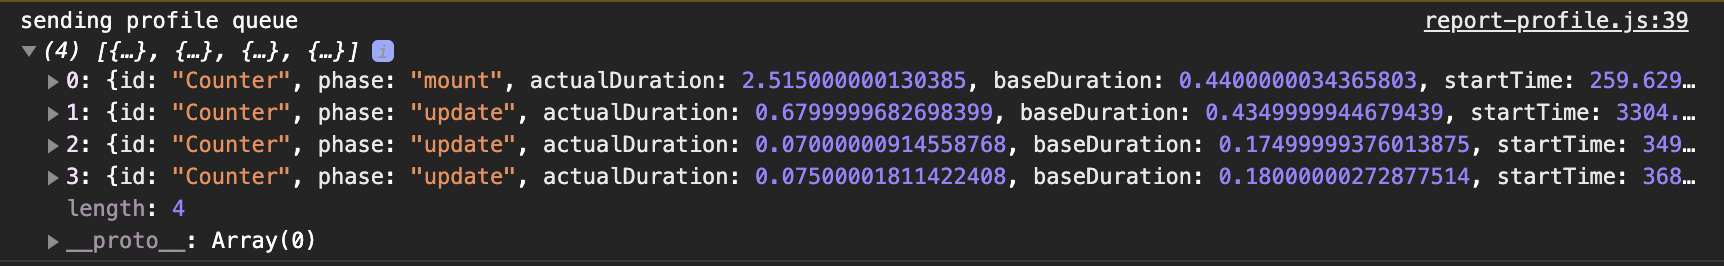
// This module is just here for the exercise and doesn't actually do anything.
// In reality, what I would recommend for a function like this is that it keeps
// a queue of all updates and every 10 seconds it sends profile data to your
// server if there's any data in the queue.
// Then you presumably graph that data in Grafana or similar
let queue = []

// we're doing every 5 seconds so we don't have to wait forever...
// actual time may vary based on your app's needs
setInterval(sendProfileQueue, 5000)

function reportProfile(
  id, // the "id" prop of the Profiler tree that has just committed
  phase, // either "mount" (if the tree just mounted) or "update" (if it re-rendered)
  actualDuration, // time spent rendering the committed update
  baseDuration, // estimated time to render the entire subtree without memoization
  startTime, // when React began rendering this update
  commitTime, // when React committed this update
  interactions, // the Set of interactions belonging to this update
) {
  queue.push({
    id,
    phase,
    actualDuration,
    baseDuration,
    startTime,
    commitTime,
    interactions,
  })
  // this is a fire and forget, so we don't return anything.
}

function sendProfileQueue() {
  if (!queue.length) {
    return Promise.resolve()
  }
  const queueToSend = [...queue]
  queue = []
  console.info('sending profile queue', queueToSend)
  // here's where we'd actually make the server call to send the queueToSend
  // data to our backend... But we don't have a backend for this workshop so...
  return Promise.resolve()
}

export default reportProfile
You will see the performance infomation log into the console.
Trace:
import React from 'react'
import {unstable_trace as trace} from 'scheduler/tracing'
import reportProfile from '../report-profile'

function Counter() {
  const [count, setCount] = React.useState(0)
  const increment = () =>
    trace('click', performance.now(), () => setCount(c => c + 1))
  return <button onClick={increment}>{count}</button>
}

function App() {
  return (
    <div>
      <React.Profiler id="counter" onRender={reportProfile}>
        <div>
          Profiled counter
          <Counter />
        </div>
      </React.Profiler>
      <div>
        Unprofiled counter
        <Counter />
      </div>
    </div>
  )
}

export default App


 浙公网安备 33010602011771号