
[Machine Learning] Octave Plotting Data
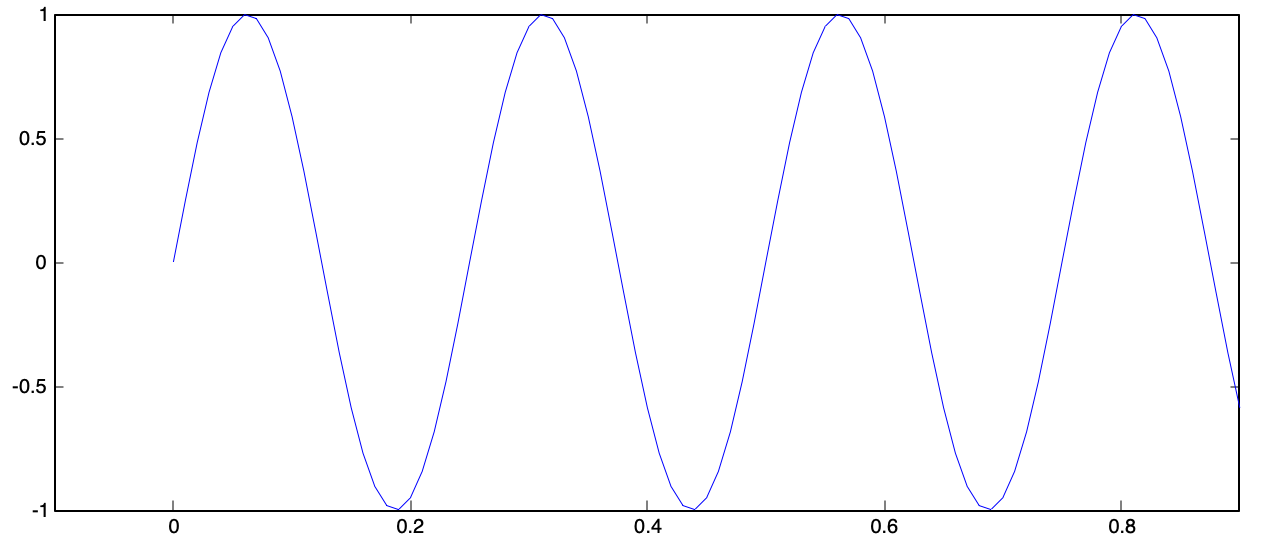
t=[0:0.01:0.98];
y1 = sin(2*pi*4*t);
plot(t, y1)
If you draw tha cos function, it will replace the sin function figure to a new one
y2 = cos(2*pi*4*t);
plot(t, y2)
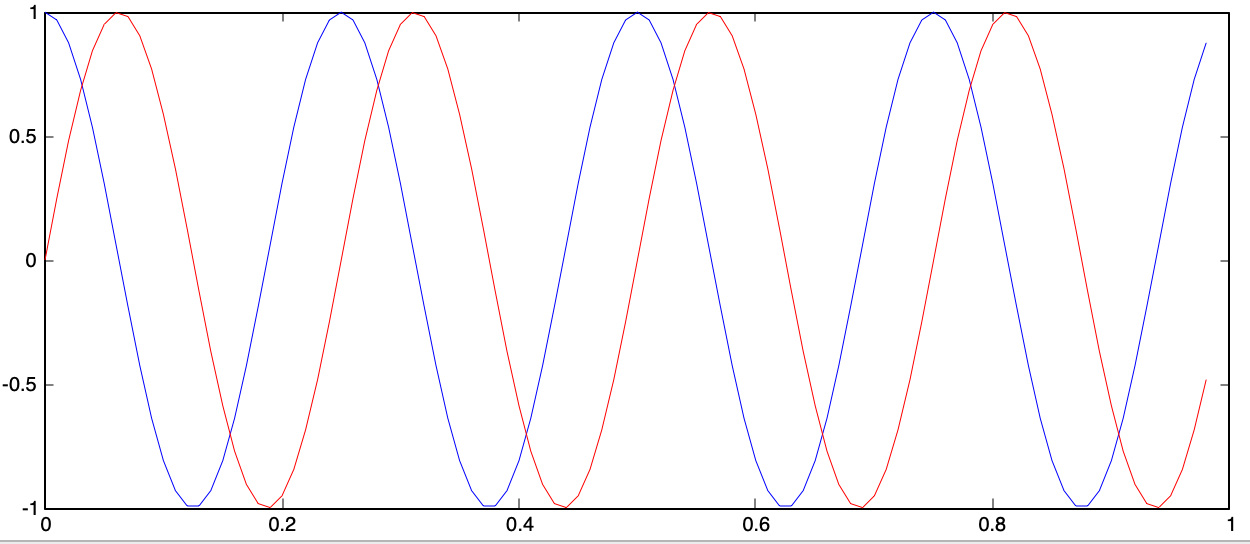
So what if I want to draw cos and sin together in one plot?
hold on;
plot(t, y1)
plot(t, y2, 'r') # plot in red color
Add labels:
>> xlabel('time')
>> ylabel('value')
>> legend('cos', 'sin')
>> title('my plot')
Save the plot:
print -dpng 'myPlot.png'
Close the plot:
close
Figure:
You can tell to generate different figures:
figure(1); plot(t, y1);
figure(2); plot(t, y2);
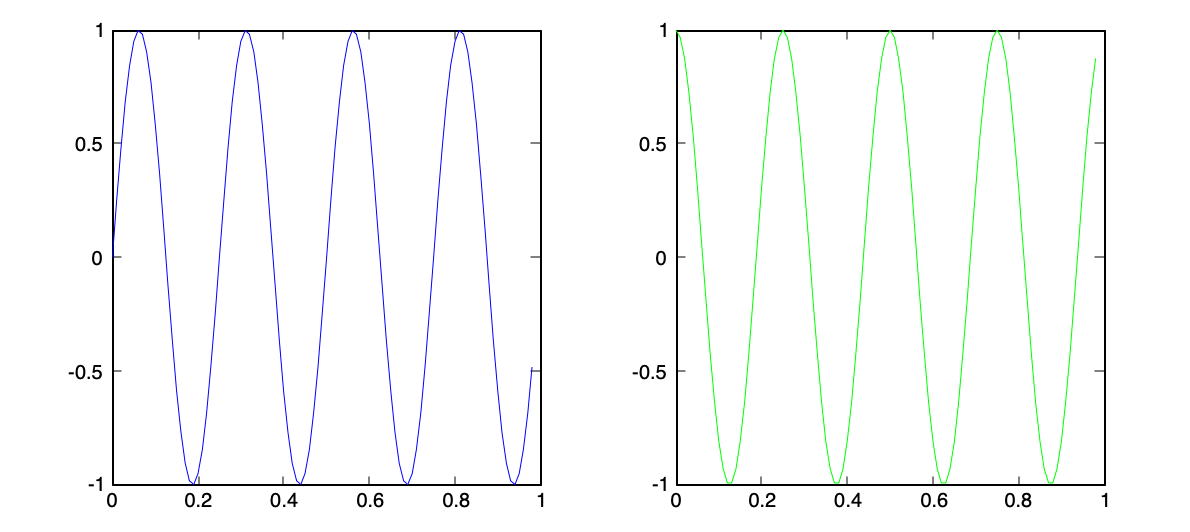
Subplot:
subplot(1, 2, 1); # Divides plot a 1 * 2 grid, access first element
plot(t, y1)
subplot(1, 2, 2);
plot(t, y2, 'g')
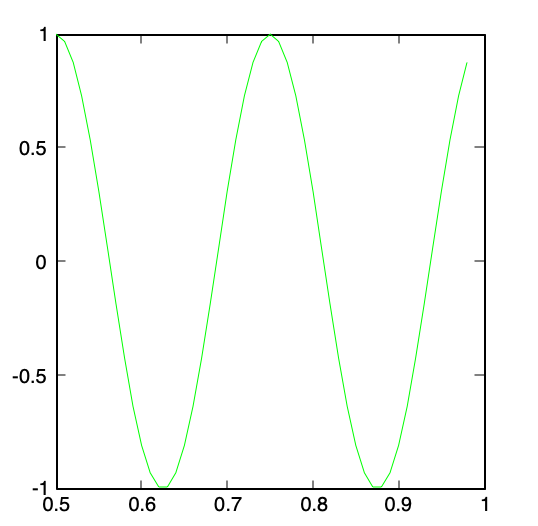
axis:
Change the range of axis. axis([x0, x1, y0, y1])
axis([0.5 1 -1 1])
Clear the figure:
clf
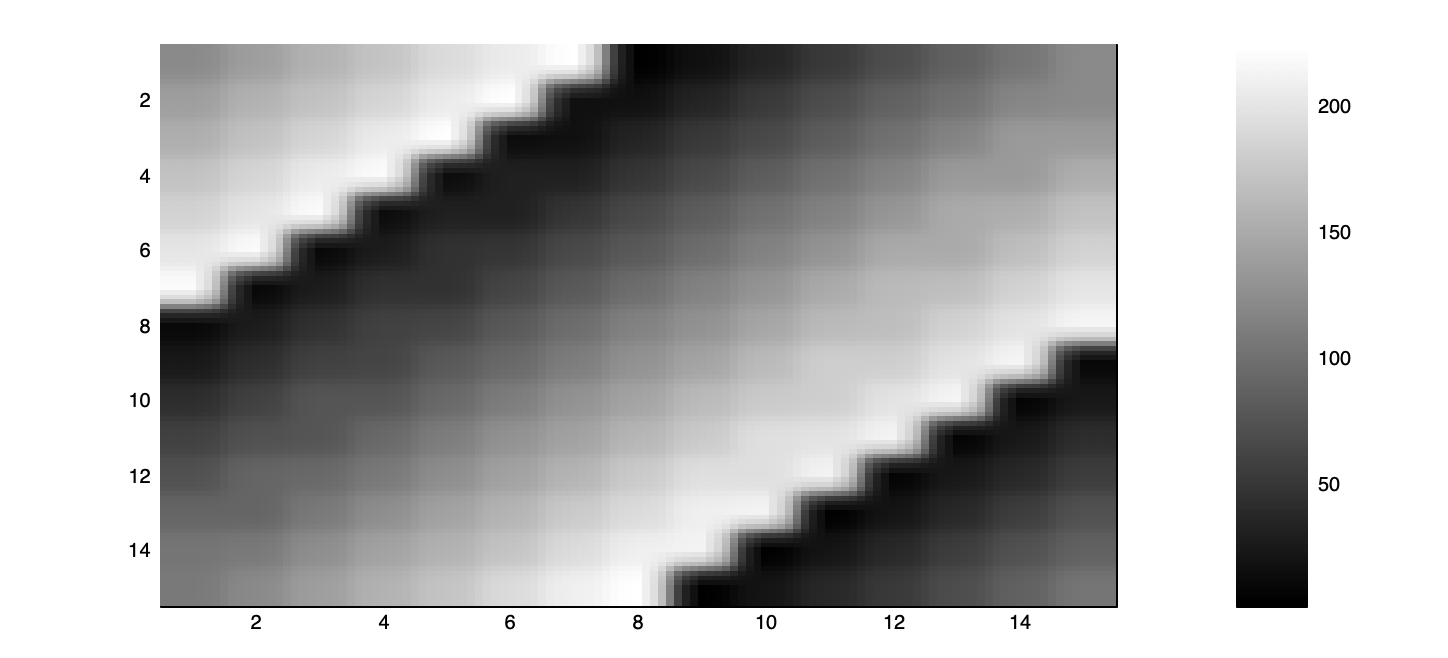
iamgesc:
a = magic(5)
imagesc(a), colorbar, colormap gray; # multi commands in one line

 浙公网安备 33010602011771号