[Debug] Set and remove DOM breakpoints

When building a web app, sometimes we need to approach it top-down. Modern browser devtools allow us to set breakpoints not only on the JS code but also on the DOM as well, so we can easily pin down which lines of code are to be executed deep inside the code base, by pausing the execution based on DOM changes.

In this lesson, we will learn how to set and remove DOM breakpoints in Chrome DevTools.


If you want to find out which part of code updating the DOM, you can use "subtree modifications":


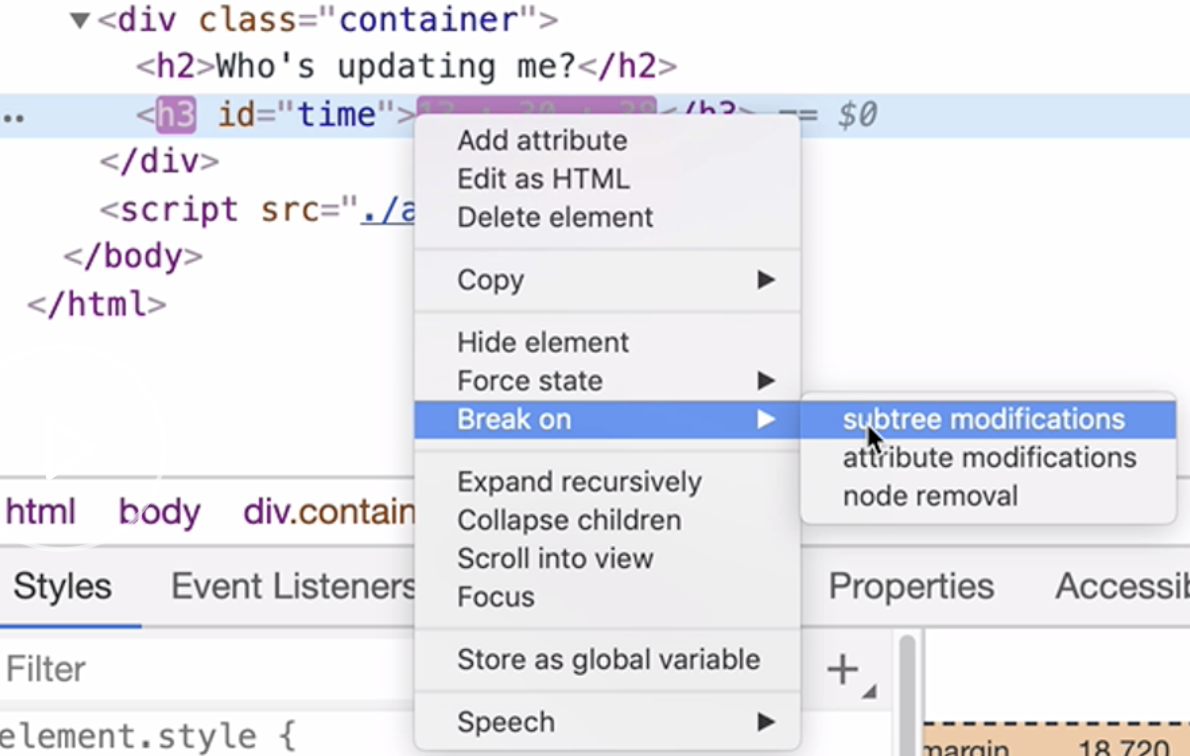
Next time when code try to udpate the DOM, it will pause execution, and open the debugger.


To remove the breakpoints, in devtool -- "Elements" -- "DOM Breakpoints", remove all breakpoints.

posted @   Zhentiw  阅读(109)  评论(0编辑  收藏  举报
编辑推荐:
· SQL Server 2025 AI相关能力初探
· Linux系列:如何用 C#调用 C方法造成内存泄露
· AI与.NET技术实操系列(二):开始使用ML.NET
· 记一次.NET内存居高不下排查解决与启示
· 探究高空视频全景AR技术的实现原理
阅读排行:
· 阿里最新开源QwQ-32B,效果媲美deepseek-r1满血版,部署成本又又又降低了!
· Manus重磅发布:全球首款通用AI代理技术深度解析与实战指南
· 开源Multi-agent AI智能体框架aevatar.ai,欢迎大家贡献代码
· 被坑几百块钱后,我竟然真的恢复了删除的微信聊天记录!
· AI技术革命,工作效率10个最佳AI工具
历史上的今天:
2019-02-16 [Algorithm] Construct a Binary Tree and Binary Search
2018-02-16 [Unit Testing] Configure the Angular CLI to use the Karma Mocha test reporter
2017-02-16 [React Native] Installing and Linking Modules with Native Code in React Native
2016-02-16 [Regular Expressions] Match the Same String Twice
2016-02-16 [Regular Expressions] Find the Start and End of Whole Words
2015-02-16 [Bootstrap] 2. class 'row' & 'col-md-x' & 'col-md-offset-x'
点击右上角即可分享
微信分享提示