UnityUI绘制柱状统计图
柱状统计图可以在线状统计图的基础上进行修改
线状统计图在这里:https://www.cnblogs.com/AlphaIcarus/p/16123434.html
在MyGraph中添加新方法来画出柱状图
private GameObject CreateBar(Vector2 pos, float width)
    {
        GameObject gameObject = new GameObject("bar", typeof(Image));
        gameObject.transform.SetParent(graphContainer, false);
        RectTransform rectTransform = gameObject.GetComponent<RectTransform>();

        rectTransform.anchoredPosition = new Vector2(pos.x, 0f);
        rectTransform.sizeDelta = new Vector2(width, pos.y);
        rectTransform.anchorMin = new Vector2(0, 0);
        rectTransform.anchorMax = new Vector2(0, 0);
        return gameObject;
    }
然后修改ShowGraph方法
private void ShowGraph(List<int> valueList)
    {
        ......
        for (int i = 0; i < valueList.Count; i++)
        {
            float xPos = i * xSpace;
            float yPos = ySpace * valueList[i];

            //添加一个画柱状图的方法即可
            CreateBar(new Vector2(xPos, yPos), xSpace * 0.5f);

            //暂时注释掉线状图的方法
            /*GameObject dotGameobject = CreateDot(new Vector2(xPos, yPos));
            if (lastPoint != null)
            {
                DrawLine(lastPoint.GetComponent<RectTransform>().anchoredPosition, dotGameobject.GetComponent<RectTransform>().anchoredPosition);
            }
            lastPoint = dotGameobject;*/
            ......
        }
        ......
    }
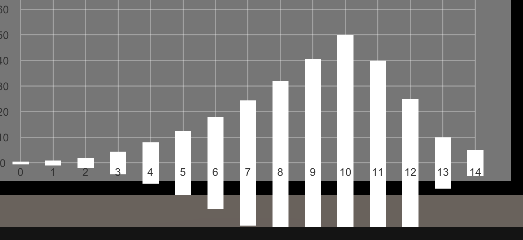
显示结果:

这个问题是因为图片的锚点位于中心
可以将柱状图片的锚点设为底部中心,或者上移图片,增加y 坐标
这里我重新设置图片的锚点
在return前添加一句即可
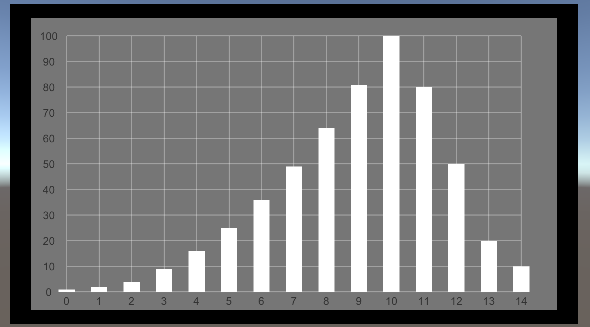
rectTransform.pivot = new Vector2(0.5f, 0f);
显示效果:

最后可以将画线状图和柱状图分别设为两个方法,然后通过UI的选择来调用


