Flink Backpressure指标和机制
页面上反压指标意义
为了判断是否进行反压,jobmanager会每50ms触发100次stack traces。
Web界面中显示阻塞在内部方法调用的stacktraces占所有的百分比。
例如,0.01,代表着100次中有一次阻塞在内部调用。
• OK: 0 <= Ratio <= 0.10
• LOW: 0.10 < Ratio <= 0.5
• HIGH: 0.5 < Ratio <= 1
出现反压时候典型的线程堆栈阻塞情况
"offline_data_source (42/48)" #225 prio=5 os_prio=0 tid=0x00007fb379712000 nid=0xbc5ba in Object.wait() [0x00007fb32b307000]
   java.lang.Thread.State: TIMED_WAITING (on object monitor)
	at java.lang.Object.wait(Native Method)
	at org.apache.flink.runtime.io.network.buffer.LocalBufferPool.requestMemorySegment(LocalBufferPool.java:261)
	- locked <0x00000006bf00f958> (a java.util.ArrayDeque)
	at org.apache.flink.runtime.io.network.buffer.LocalBufferPool.requestBufferBuilderBlocking(LocalBufferPool.java:218)
	at org.apache.flink.runtime.io.network.api.writer.RecordWriter.requestNewBufferBuilder(RecordWriter.java:213)
	at org.apache.flink.runtime.io.network.api.writer.RecordWriter.sendToTarget(RecordWriter.java:144)
	at org.apache.flink.runtime.io.network.api.writer.RecordWriter.emit(RecordWriter.java:107)
	at org.apache.flink.streaming.runtime.io.StreamRecordWriter.emit(StreamRecordWriter.java:81)
	at org.apache.flink.streaming.runtime.io.RecordWriterOutput.pushToRecordWriter(RecordWriterOutput.java:107)
	at org.apache.flink.streaming.runtime.io.RecordWriterOutput.collect(RecordWriterOutput.java:89)
	at org.apache.flink.streaming.runtime.io.RecordWriterOutput.collect(RecordWriterOutput.java:45)
	at org.apache.flink.streaming.api.operators.AbstractStreamOperator$CountingOutput.collect(AbstractStreamOperator.java:717)
	at org.apache.flink.streaming.api.operators.AbstractStreamOperator$CountingOutput.collect(AbstractStreamOperator.java:695)
	at org.apache.flink.streaming.api.operators.StreamMap.processElement(StreamMap.java:41)
	at org.apache.flink.streaming.runtime.io.StreamInputProcessor.processInput(StreamInputProcessor.java:202)
	- locked <0x00000006bfed93f8> (a java.lang.Object)
	at org.apache.flink.streaming.runtime.tasks.OneInputStreamTask.run(OneInputStreamTask.java:105)
	at org.apache.flink.streaming.runtime.tasks.StreamTask.invoke(StreamTask.java:300)
	at org.apache.flink.runtime.taskmanager.Task.run(Task.java:711)
	at java.lang.Thread.run(Thread.java:745)
堆栈阻塞原理过程
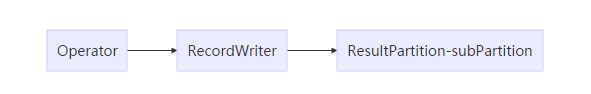
其中RecordWriter将数据(封装为BufferBuilder)被写入ResultPartition下的各个subPartition里过程中会有通过memorySegment来限流阻塞的过程。
具体做法是构造BufferBuilder时候LocalBufferPool通过requestMemorySegment()方法从NetworkBufferPool中申请memorySegment。
最多会从网络栈中申请和currentPoolSize数量相等的memorySegment对象来传递数据。
申请到的memorySegment都会用来处理传递真实数据,如果下游处理堵塞,上游netty发送数据时无法flush数据
PartitionRequestQueue.java
// Write and flush and wait until this is done before
// trying to continue with the next buffer.
channel.writeAndFlush(msg).addListener(writeListener);
进而导致无法执行回调,无法回调影响了LocalBufferPool中recycle()。无法将正在传递数据的memorySegment重新释放并加入availableMemorySegments。此时用来存储回收memorySegment对象的availableMemorySegments队列是空的,因为所有从网络栈中申请来的memorySegment都卡在flush数据环节,无法被recycle到availableMemorySegments队列。
正因如此,下面代码中会陷入死循环,一直在wait。
从而导致jobmanager每50ms触发100次stack traces都看到operator线程阻塞在这里,然后认为该operator出现了反压。
LocalBufferPool.java
	private MemorySegment requestMemorySegment(boolean isBlocking) throws InterruptedException, IOException {
		synchronized (availableMemorySegments) {
			returnExcessMemorySegments();

			boolean askToRecycle = owner.isPresent();

			// fill availableMemorySegments with at least one element, wait if required
			while (availableMemorySegments.isEmpty()) {
				if (isDestroyed) {
					throw new IllegalStateException("Buffer pool is destroyed.");
				}

				if (numberOfRequestedMemorySegments < currentPoolSize) {
					final MemorySegment segment = networkBufferPool.requestMemorySegment();

					if (segment != null) {
						numberOfRequestedMemorySegments++;
						return segment;
					}
				}

				if (askToRecycle) {
					owner.get().releaseMemory(1);
				}

				if (isBlocking) {
					availableMemorySegments.wait(2000);
				}
				else {
					return null;
				}
			}

			return availableMemorySegments.poll();
		}
	}
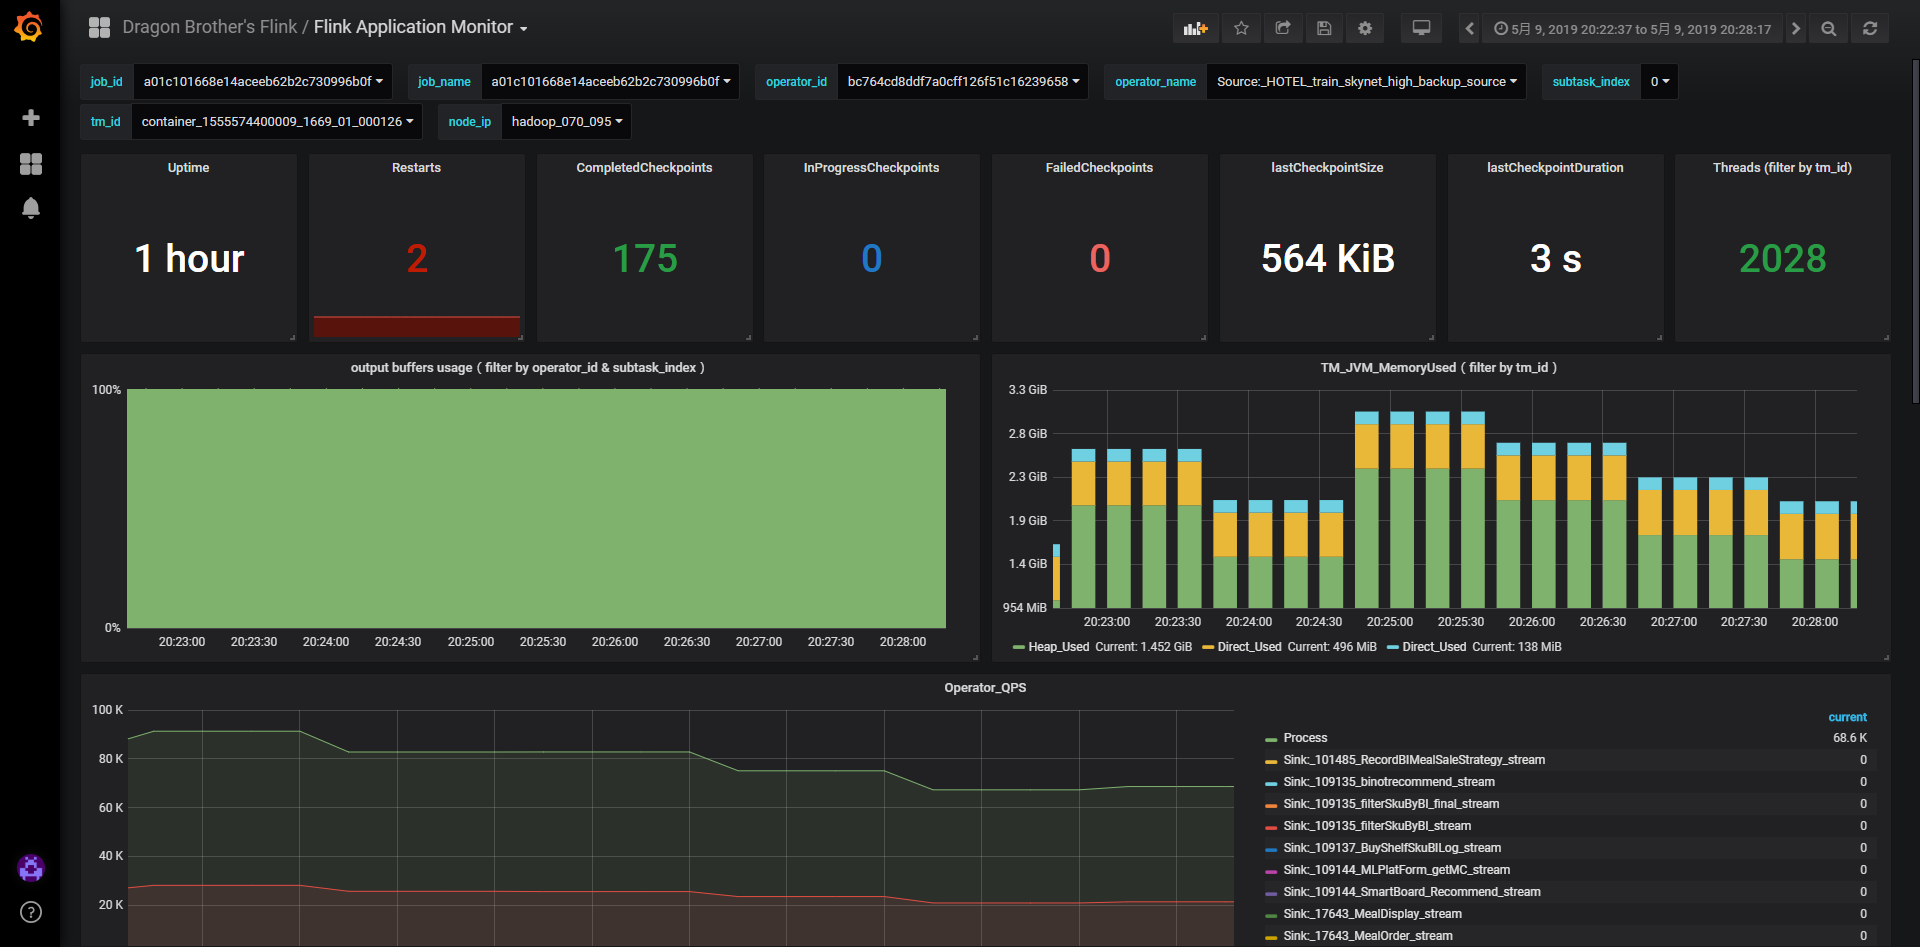
监控
可以通过flink metrics中的output buffer usage指标来确定是否下游出现了背压,具体指标为flink_taskmanager_job_task_buffers_outPoolUsage
如下图,如果usage打满到100%则说明出现了严重的背压情况
其它
所以出现反压的时候,罪魁祸首往往不是flink UI上backpressure HIGH的那个operator,而是最后一个HIGH operator下游的那个operator
参考文章
想要的都拥有,得不到的都释怀。

 浙公网安备 33010602011771号