
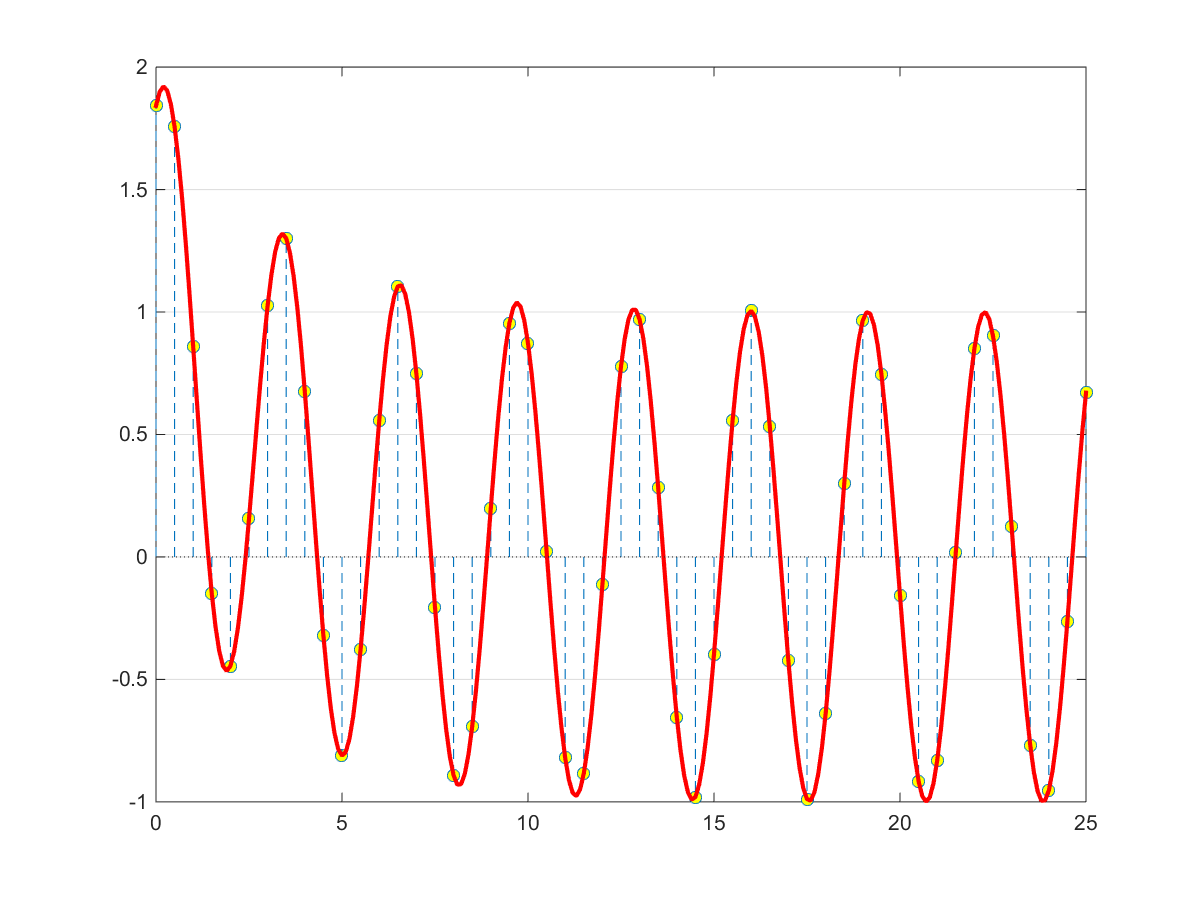
t=[0:0.5:25];
y=exp(-t/3)+sin(1+2*t);
h=stem(t,y,'--');
set(get(h,'baseline'),'linestyle',':');   %把水平轴设置成: 的形状
set(h,'markerfacecolor','yellow');
hold on
t2=[0:0.1:25];
y2=exp(-t2/3)+sin(1+2*t2);
plot(t2,y2,'r','linewidth',2);
box on;
set(gca,'Ygrid','on')

 浙公网安备 33010602011771号