4-4 盒图绘制
In [1]:
%matplotlib inline
np.random.normal()的意思是一个正态分布:numpy.random.normal(loc=0,scale=1e-2,size=shape)
- 参数loc(float):正态分布的均值,对应着这个分布的中心。loc=0说明这一个以Y轴为对称轴的正态分布,
- 参数scale(float):正态分布的标准差,对应分布的宽度,scale越大,正态分布的曲线越矮胖,scale越小,曲线越高瘦。
- 参数size(int 或者整数元组):输出的值赋在shape里,默认为None。
-
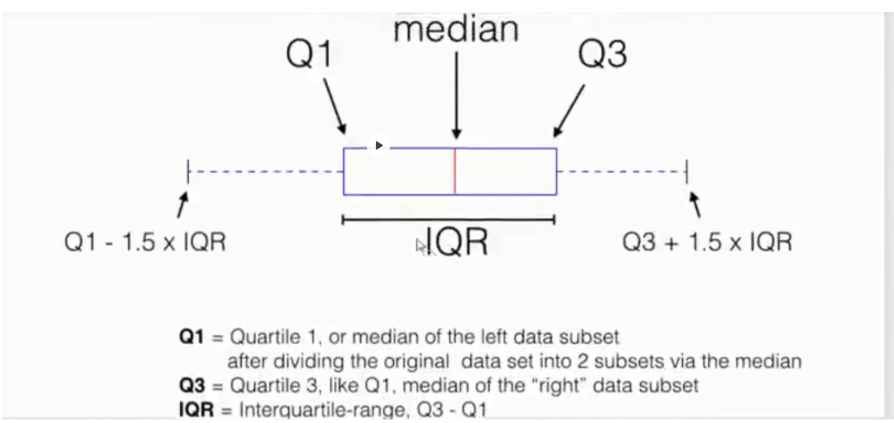
boxplot(sym = 'o', #异常点形状
vert = True, # 是否垂直
whis=1.5, # IQR
patch_artist = True, # 上下四分位框是否填充
meanline = False,showmeans = True, # 是否有均值线及其形状
showbox = True, # 是否显示箱线
showfliers = True, #是否显示异常值
notch = False, # 中间箱体是否缺口
return_type='dict') # 返回类型为字典
In [2]:
import matplotlib.pyplot as plt
import numpy as np

tang_data=[np.random.normal(0,std,100) for std in range(1,4)]
fig=plt.figure(figsize=(8,6))
plt.boxplot(tang_data,notch=False,sym='s',vert=True)

plt.xticks([y+1 for y in range(len(tang_data))],['x1','x2','x3'])
plt.xlabel('x')
plt.title('boxplot')
Out[2]:

2.设置黑白的的箱型图
In [3]:
tang_data=[np.random.normal(0,std,100) for std in range(1,4)]
fig=plt.figure(figsize=(8,6))
bplot=plt.boxplot(tang_data,notch=False,sym='s',vert=True)

plt.xticks([y+1 for y in range(len(tang_data))],['x1','x2','x3'])
plt.xlabel('x')
plt.title('boxplot')

#设置每个线条颜色
for components in bplot.keys():
    for line in bplot[components]:
        line.set_color('black')

3.画横的箱型图:修改参数vert=False
In [4]:
tang_data=[np.random.normal(0,std,100) for std in range(1,4)]
fig=plt.figure(figsize=(8,6))
bplot=plt.boxplot(tang_data,notch=False,sym='s',vert=False)

plt.yticks([y+1 for y in range(len(tang_data))],['x1','x2','x3'])
plt.ylabel('x')
plt.title('boxplot')
Out[4]:

4.notch = False #中间箱体是否缺口
In [5]:
tang_data=[np.random.normal(0,std,100) for std in range(1,4)]
fig=plt.figure(figsize=(8,6))
bplot=plt.boxplot(tang_data,notch=True,sym='s',vert=False)

plt.yticks([y+1 for y in range(len(tang_data))],['x1','x2','x3'])
plt.ylabel('x')
plt.title('boxplot')
Out[5]:

5.填充颜色:添加属性设置patch_artist=True,设置颜色 pathch.set_facecolor(color)
In [6]:
tang_data=[np.random.normal(0,std,100) for std in range(1,4)]
fig=plt.figure(figsize=(8,6))
bplot=plt.boxplot(tang_data,notch=False,sym='s',vert=False,patch_artist=True)#patch_artist=True上下四分位框是否填充

plt.yticks([y+1 for y in range(len(tang_data))],['x1','x2','x3'])
plt.ylabel('x')
plt.title('boxplot')

#填充颜色
colors=['pink','lightblue','lightgreen']#颜色定义
for pathch,color in zip(bplot['boxes'],colors):
    pathch.set_facecolor(color)#设置颜色

小提琴图 violinplot
In [7]:
fig,axes=plt.subplots(nrows=1,ncols=2,figsize=(12,5))#设置小提琴图1行2列
tang_data=[np.random.normal(0,std,100)for std in range (6,10)]#设置数据
axes[0].violinplot(tang_data,showmeans=False,showmedians=True)#画小提琴图
axes[0].set_title('violin plot')

axes[1].boxplot(tang_data)#画箱型图
axes[1].set_title('box_plot')

#grid画横线
for ax in axes:
    ax.yaxis.grid(True)
    ax.set_xticks([y+1 for y in range(len(tang_data))])

#标注X轴lable
plt.setp(axes,xticks=[y+1 for y in range(len(tang_data))],xticklabels=['x1','x2','x3','x4'])
Out[7]:

此资源来自https://www.cnblogs.com/AI-robort/,博客园的karina512。

 浙公网安备 33010602011771号