
爬取B站动画排行榜
一、 选题的背景
为什么要选择此选题?要达到的数据分析的预期目标是什么?(10分)
我对B站动画感兴趣,想探寻一下几部动画收藏量观看次数等的关系。

二、主题式网络爬虫设计方案(10分)
1.主题式网络爬虫名称
Python网络爬虫——爬取B站动画排行榜
2.主题式网络爬虫爬取的内容与数据特征分析
爬取B站动画排行榜数据做可视化处理
三、主题页面的结构特征分析
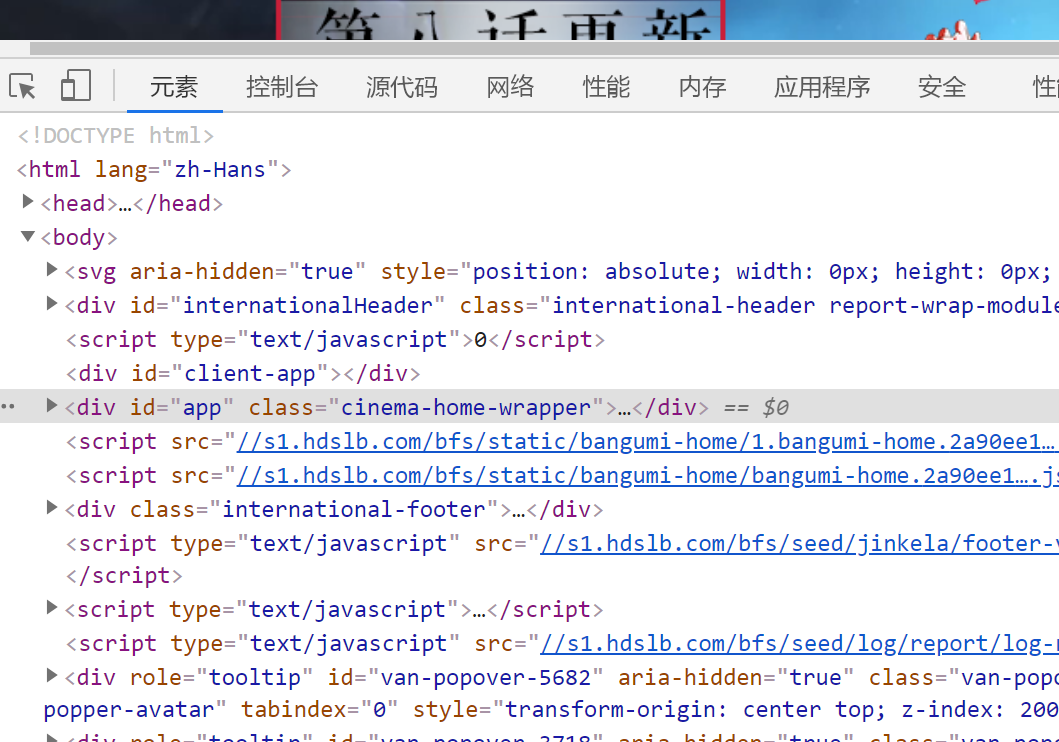
1.主题页面的结构与特征分析
1.主题页面的结构与特征分析:打开开发者控制工具,通过逐个检索分析找到自己需要的数据
2.解析Htmls
 1 import requests
 2 from bs4 import BeautifulSoup
 3 import bs4
 4 #引入pandas用于数据可视化
 5 import pandas as pd
 6 from pandas import DataFrame
 7 import seaborn as sns
 8 import numpy as np
 9 import matplotlib.pyplot as plt
10 from scipy.optimize import leastsq
11 from sklearn.linear_model import LinearRegression
12
13
14 headers={'User-Agent':'Mozilla/5.0 (Windows NT 10.0; WOW64) AppleWebKit/537.36 (KHTML, like Gecko) Chrome/84.0.4147.89 Safari/537.36 SLBrowser/7.0.0.6241 SLBChan/30'}
15 r = requests.get(url,  headers=headers,timeout=10)
16
17 def getHTMLText(url,timeout = 30):
18     try:
19         #用requests抓取网页信息
20         r = requests.get(url, timeout = 30)
21         #可以让程序产生异常时停止程序
22         r.raise_for_status()
23         #设置编码标准
24         r.encoding = r.apparent_encoding
25         return r.text
26     except:
27         return '产生异常'
28
29
30 html=r.text
31 soup=BeautifulSoup(html,'html.parser')
32 print(soup.prettify())
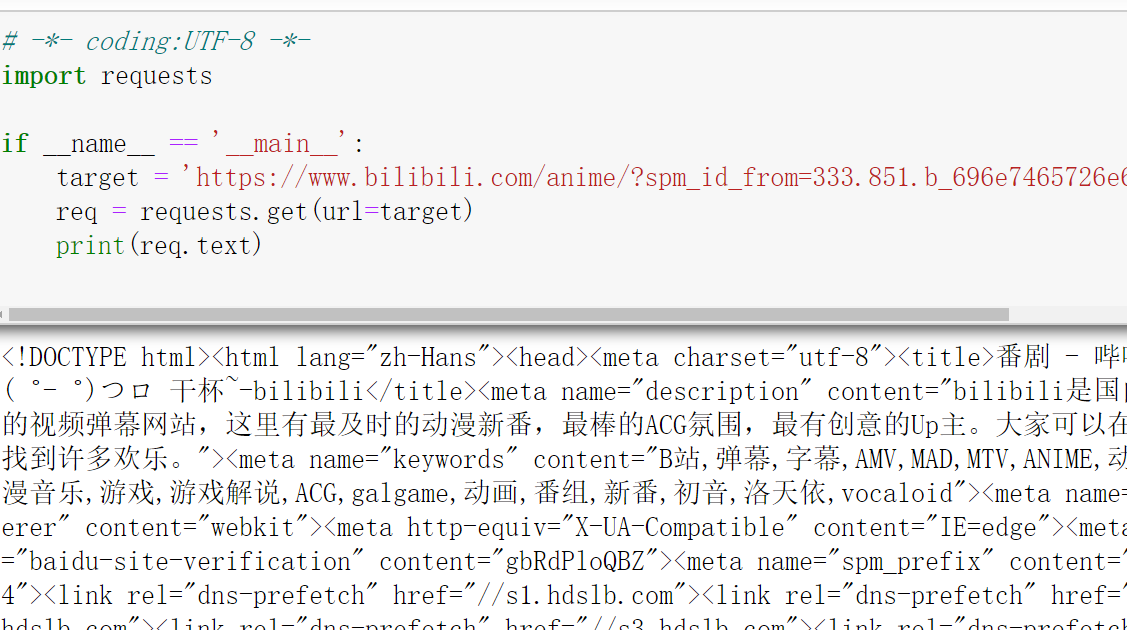
1 # -*- coding:UTF-8 -*-
2 import requests
3
4 if __name__ == '__main__':
5     target = 'https://www.bilibili.com/anime/?spm_id_from=333.851.b_696e7465726e6174696f6e616c486561646572.2'
6     req = requests.get(url=target)
7     print(req.text)
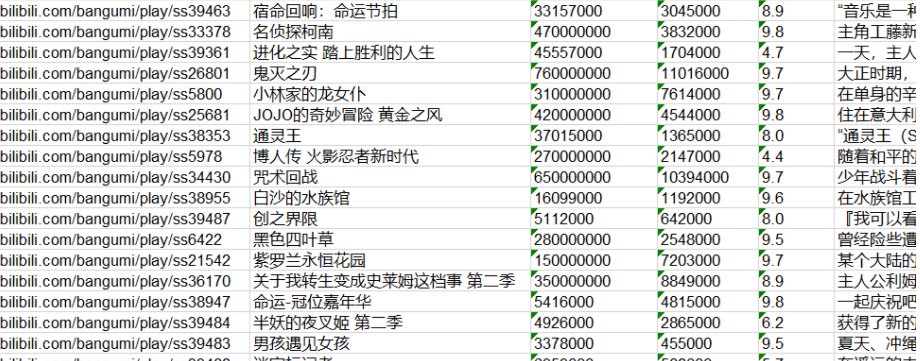
存excel:
 1 book = xlwt.Workbook(encoding="utf-8",style_compression=0)
 2     #创建workbook对象
 3 sheet = book.add_sheet('B站动画排行榜',cell_overwrite_ok=True)
 4     #创建工作表
 5 col = ("排名","链接","标题","播放量","收藏数","评分","介绍")
 6 for i in range(0,7):
 7     sheet.write(0,i,col[i])
 8     #列名
 9 for i in range(0,50):
10     data = datalist[i]
11     for j in range(0,7):
12         sheet.write(i+1,j,data[j])
13         #数据
14 savepath = ".\\123.xls"
15 book.save(savepath)
16 print('成功')
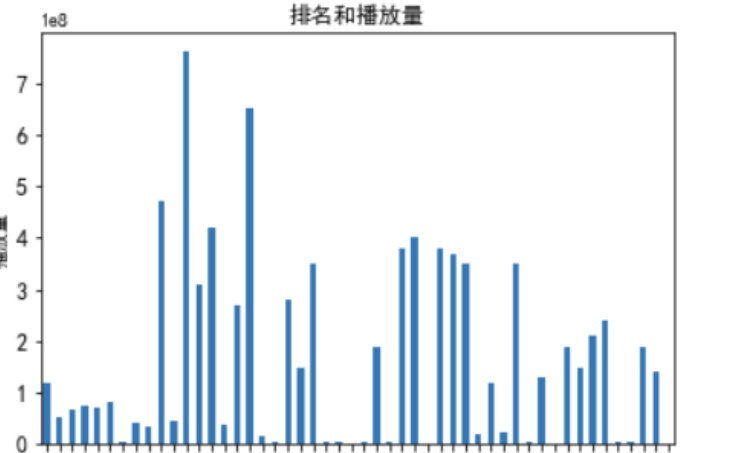
 1 import matplotlib.pyplot as plt
 2 import pandas as pd
 3 import numpy as np
 4 qidian_df=pd.read_excel(r'C:\Users\1.xls')
 5 data=np.array(qidian_df['播放量'][0:12])
 6 #索引
 7 index=np.arange(1,11)
 8
 9 plt.rcParams['font.sans-serif']=['Arial Unicode MS']
10 #修改x轴字体
11 plt.xticks(fontsize=12)
12 #修改y轴字体
13 plt.yticks(fontsize=12)
14 print(data)
15 print(index)
16 #x标签
17 plt.xlabel('排名')
18 #y标签
19 plt.ylabel('播放量')
20 s = pd.Series(data, index)
21 s.plot(kind='bar',color='b')
22 plt.grid()
23 plt.show()
1 import seaborn as sns
2 sns.regplot(df.排名,df.评分)

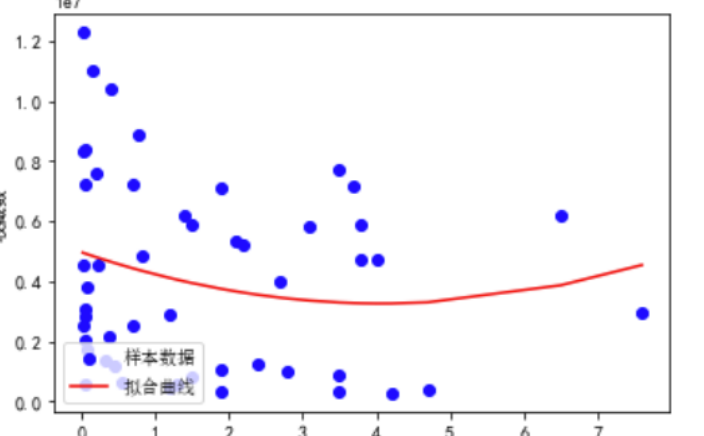
 1 predict_model=LinearRegression()
 2 x=df_1[["播放量"]]
 3 y=df["收藏数"]
 4 predict_model.fit(x,y)
 5 print("回归方程系数为{}".format( predict_model.coef_))
 6 print("回归方程截距:{0:2f}".format( predict_model.intercept_))
 7
 8 x0=np.array(df_1['播放量'])
 9 y0=np.array(df['收藏数'])
10 def func(x,c0):
11     a,b,c=c0
12     return a*x**2+b*x+c
13 def errfc(c0,x,y):
14     return y-func(x,c0)
15 c0=[0,2,3]
16 c1=opt.leastsq(errfc,c0,args=(x0,y0))[0]
17 a,b,c=c1
18 print(f"拟合方程为:y={a}*x**2+{b}*x+{c}")
19 chinese=matplotlib.font_manager.FontProperties(fname='C:\123.ttc')
20 plt.plot(x0,y0,"ob",label="样本数据")
21 plt.plot(x0,func(x0,c1),"r",label="拟合曲线")
22 #x标签
23 plt.xlabel("播放量")
24 #y标签
25 plt.ylabel("收藏数")
26 plt.legend(loc=3,prop=chinese)
27 plt.show()
  1 import requests
  2 from bs4 import BeautifulSoup
  3 import bs4
  4 #引入pandas用于数据可视化
  5 import pandas as pd
  6 from pandas import DataFrame
  7 import seaborn as sns
  8 import numpy as np
  9 import matplotlib.pyplot as plt
 10 from scipy.optimize import leastsq
 11 from sklearn.linear_model import LinearRegression
 12
 13 url='https://www.bilibili.com/anime/?spm_id_from=333.851.b_696e7465726e6174696f6e616c486561646572.2'
 14 headers={'User-Agent':'Mozilla/5.0 (Windows NT 10.0; WOW64) AppleWebKit/537.36 (KHTML, like Gecko) Chrome/84.0.4147.89 Safari/537.36 SLBrowser/7.0.0.6241 SLBChan/30'}
 15 r = requests.get(url,  headers=headers,timeout=10)
 16
 17 def getHTMLText(url,timeout = 30):
 18     try:
 19         #用requests抓取网页信息
 20         r = requests.get(url, timeout = 30)
 21         #可以让程序产生异常时停止程序
 22         r.raise_for_status()
 23         #设置编码标准
 24         r.encoding = r.apparent_encoding
 25         return r.text
 26     except:
 27         return '产生异常'
 28
 29
 30 html=r.text
 31 soup=BeautifulSoup(html,'html.parser')
 32 print(soup.prettify())
 33
 34
 35 #将数据保存在表格中
 36 book = xlwt.Workbook(encoding="utf-8",style_compression=0)
 37     #创建workbook对象
 38 sheet = book.add_sheet('B站动画排行榜',cell_overwrite_ok=True)
 39     #创建工作表
 40 col = ("排名","链接","标题","播放量","收藏数","评分","介绍")
 41 for i in range(0,7):
 42     sheet.write(0,i,col[i])
 43     #列名
 44 for i in range(0,50):
 45     data = datalist[i]
 46     for j in range(0,7):
 47         sheet.write(i+1,j,data[j])
 48         #数据
 49 savepath = ".\\123.xls" 50
 51 #判断文件是否存在
 52 my_file = "B站动画排行榜.xls" 53 if os.path.exists(my_file):
 54     # 如果文件已存在
 55     print('文件已存在')
 56     os.remove(my_file)
 57     # 删除
 58
 59 book.save(savepath)
 60 print('已保存表格!')
 61
 62
 63
 64 sql = '''
 65     create table rank
 66     (
 67     id integer primary key autoincrement,
 68     no numeric,
 69     link text,
 70     title varchar,
 71     watch numeric,
 72     like numeric,
 73     score numeric,
 74     info varchar
 75         )
 76 '''
 77 dbpath = "rank.db" 78
 79
 80 my_file = "rank.db" 81 if os.path.exists(my_file):
 82     # 如果文件已存在
 83     print('文件已存在')
 84     os.remove(my_file)
 85     # 删除
 86
 87 conn = sqlite3.connect(dbpath)
 88 cursor = conn.cursor()
 89 cursor.execute(sql)
 90 conn.commit()
 91 conn.close()
 92
 93 conn = sqlite3.connect(dbpath)
 94 cur = conn.cursor()
 95 for data in datalist:
 96     #将所有字符串类型的数据的前后都加上双引号
 97     for index in range(len(data)):
 98
 99         #跳过不需要加双引号的数据
100         if index == 0 or index == 3 or index == 4 or index == 5:
101             continue
102         data[index] = '"'+data[index]+'"'
103     sql = '''
104             insert into top50 (
105             no,link,title,watch,like,score,info)
106             values(%s)'''%",".join(data)
107     print(sql)
108     cur.execute(sql)
109     conn.commit()
110
111 cur.close()
112 conn.close()
113 print('已保存数据表!')
114 print("爬取完毕")
115
116
117118 #读取表格信息
119 df=pd.read_excel(r'123.xls')
120 R=pd.DataFrame(df)
121
122 #检查是否有重复值
123 print(R.duplicated())
124 #检查是否有空值
125 print(R['排名'].isnull().value_counts())
126 print(R['链接'].isnull().value_counts())
127 print(R['标题'].isnull().value_counts())
128 print(R['播放量'].isnull().value_counts())
129 print(R['收藏数'].isnull().value_counts())
130 print(R['评分'].isnull().value_counts())
131 print(R['介绍'].isnull().value_counts())
132
133
134 #数据分析
135 df_1=df.sort_values('播放量',ascending=True)
136 #根据播放量升序排序
137
138
139 #排名和各类数量关系图
140 plt.xticks(fontsize=8)
141 plt.yticks(fontsize=12)
142 plt.rcParams['font.sans-serif']=['SimHei']
143 s = pd.Series(df.播放量,df.排名)
144 s.plot(kind="bar",title="排名和播放量")
145 #x标签
146 plt.xlabel("排名")
147 #y标签
148 plt.ylabel("播放量")
149 #显示图形
150 plt.show()
151
152 s = pd.Series(df.收藏数,df.排名)
153 s.plot(kind="bar",title="排名和收藏数")
154 plt.xticks(fontsize=8)
155 plt.yticks(fontsize=12)
156 #x标签
157 plt.xlabel("排名")
158 #y标签
159 plt.ylabel("收藏数")
160 #显示图形
161 plt.show()
162
163 s = pd.Series(df.评分,df.排名)
164 s.plot(kind="bar",title="排名和评分")
165 plt.xticks(fontsize=8)
166 plt.yticks(fontsize=12)
167 #x标签
168 plt.xlabel("排名")
169 #y标签
170 plt.ylabel("评分")
171 #显示图形
172 plt.show()
173
174
175 176 plt.rcParams['font.sans-serif']=['Arial Unicode MS']
177 plt.rcParams['axes.unicode_minus']=False
178 plt.xticks(fontsize=12)
179 plt.yticks(fontsize=12)
180 #散点
181 plt.scatter(df_1.播放量,df.收藏数, color='b')
182 plt.rcParams['font.sans-serif']=['SimHei']
183 #x标签
184 plt.xlabel('播放量')
185 #y标签
186 plt.ylabel('收藏数')
187 #显示图形
188 plt.show()
189
190
191
192
193
194 predict_model=LinearRegression()
195 x=df_1[["播放量"]]
196 y=df["收藏数"]
197 predict_model.fit(x,y)
198 print("回归方程系数为{}".format( predict_model.coef_))
199 print("回归方程截距:{0:2f}".format( predict_model.intercept_))
200
201 x0=np.array(df_1['播放量'])
202 y0=np.array(df['收藏数'])
203 def func(x,c0):
204     a,b,c=c0
205     return a*x**2+b*x+c
206 def errfc(c0,x,y):
207     return y-func(x,c0)
208 c0=[0,2,3]
209 c1=opt.leastsq(errfc,c0,args=(x0,y0))[0]
210 a,b,c=c1
211 print(f"拟合方程为:y={a}*x**2+{b}*x+{c}")
212 chinese=matplotlib.font_manager.FontProperties(fname='C:\Windows\Fonts\simsun.ttc')
213 plt.plot(x0,y0,"ob",label="样本数据")
214 plt.plot(x0,func(x0,c1),"r",label="拟合曲线")
215 #x标签
216 plt.xlabel("播放量")
217 #y标签
218 plt.ylabel("收藏数")
219 plt.legend(loc=3,prop=chinese)
220 #显示图形
221 plt.show()
222
223
224
225 predict_model=LinearRegression()
226 x=df[["排名"]]
227 y=df["收藏数"]
228 predict_model.fit(x,y)
229 print("回归方程系数为{}".format( predict_model.coef_))
230 print("回归方程截距:{0:2f}".format( predict_model.intercept_))
231
232 x0=np.array(df['排名'])
233 y0=np.array(df['收藏数'])
234 def func(x,c0):
235     a,b,c=c0
236     return a*x**2+b*x+c
237 def errfc(c0,x,y):
238     return y-func(x,c0)
239 c0=[0,2,3]
240 c1=opt.leastsq(errfc,c0,args=(x0,y0))[0]
241 a,b,c=c1
242 print(f"拟合方程为:y={a}*x**2+{b}*x+{c}")
243 chinese=matplotlib.font_manager.FontProperties(fname='C:\Windows\Fonts\simsun.ttc')
244 plt.plot(x0,y0,"or",label="样本数据")
245 plt.plot(x0,func(x0,c1),"b",label="拟合曲线")
246 #x标签
247 plt.xlabel("排名")
248 #y标签
249 plt.ylabel("收藏数")
250 plt.legend(loc=3,prop=chinese)
251 #显示图形
252 plt.show()
总结:虽然出来的结果十分粗糙且还仍有进步空间,但此次爬取B站动画排行令我对网络爬虫的认识更进一步,在看过其他同学的作业后让我知道了我与他人的明显差距。这激起我不断挑战自我的动力,让我奋发向前。
