


Prometheus监控详述
Prometheus
Prometheus是一款专门用来监控容器的一款软件。
传统的监控软件大多数是依赖于IP的,但是容器没有该固定的IP,再面对容器的时候,传统的监控软件就显得很茫然。
1、监控
什么是监控呢?
运维工程师是无法做到每天24小时时时刻刻盯着服务器,这个时候为了能够立即发现服务器异常,我们就需要有一款专门用来盯着服务器的软件,来帮助运维工程师监控服务器的状态,如果出现服务器异常,能够实时提醒运维工程师。
2、传统的监控举例
传统的命令监控无法做到实时监控并报警,就需要一款专门的监控软件来帮助我们实现实时监控并报警。
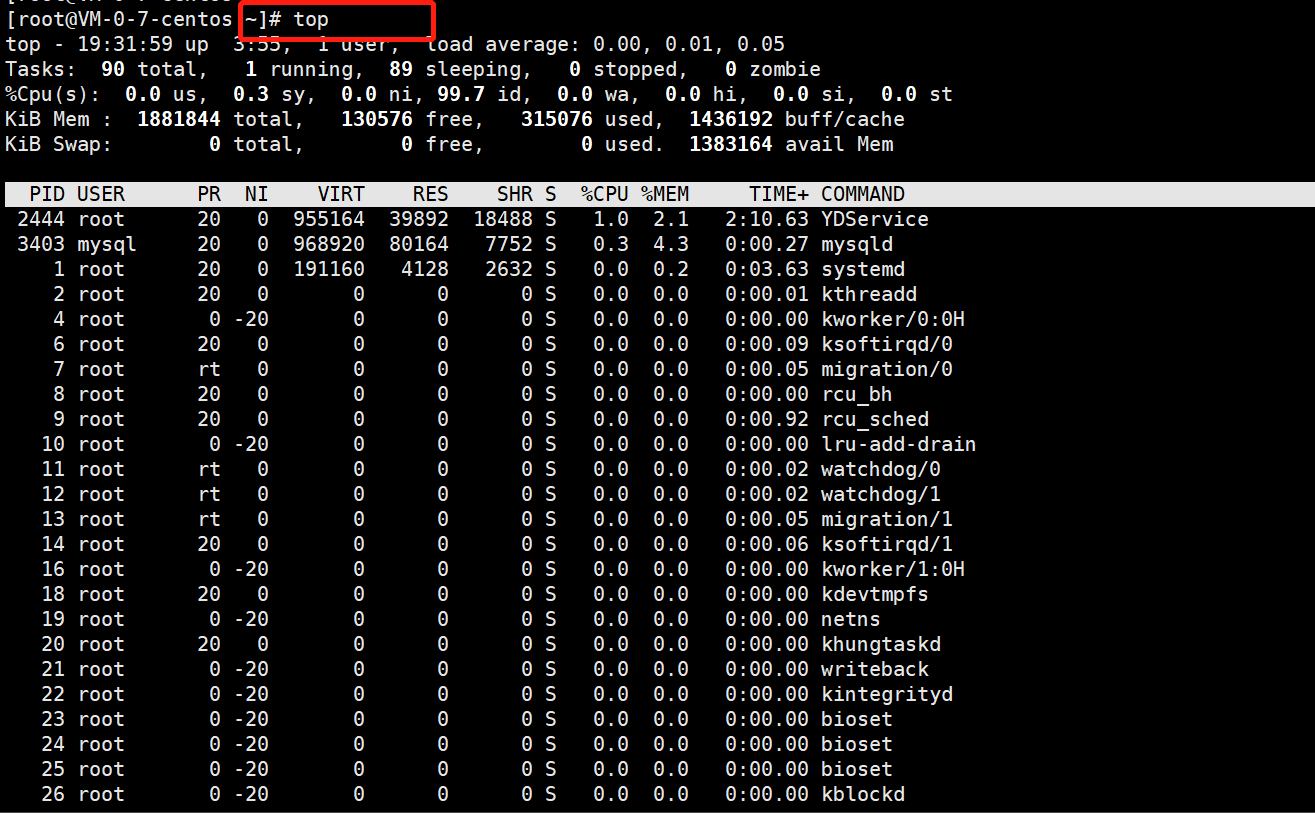
top命令
[root@VM-0-7-centos ~]# top
top - 19:32:17 up  3:55,  1 user,  load average: 0.00, 0.01, 0.05
Tasks:  90 total,   1 running,  89 sleeping,   0 stopped,   0 zombie
%Cpu(s):  0.2 us,  0.2 sy,  0.0 ni, 99.7 id,  0.0 wa,  0.0 hi,  0.0 si,  0.0 st
KiB Mem :  1881844 total,   130244 free,   315308 used,  1436292 buff/cache
KiB Swap:        0 total,        0 free,        0 used.  1382904 avail Mem

  PID USER      PR  NI    VIRT    RES    SHR S  %CPU %MEM     TIME+ COMMAND
  2444 root      20   0  955164  39892  18488 S   0.7  2.1   2:10.79 YDService
   944 root      20   0  680292  14432   2480 S   0.3  0.8   0:46.53 barad_agent
    1  root      20   0  191160   4128   2632 S   0.0  0.2   0:03.63 systemd
3、Prometheus监控软件部署
特点:1.开源免费;2.适配容器监控
1、下载
[root@VM-0-16-centos ~]# wget https://github.com/prometheus/prometheus/releases/download/v2.34.0/prometheus-2.34.0.linux-amd64.tar.gz
2、解压
[root@VM-0-16-centos ~]# tar -xf prometheus-2.25.0.linux-amd64.tar.gz -C /usr/local/
3、创建一个软连接
[root@VM-0-16-centos prometheus-2.25.0.linux-amd64]# ln -s /usr/local/prometheus-2.25.0.linux-amd64 /usr/local/prometheus
4、添加环境变量
[root@VM-0-16-centos prometheus]# vim /etc/profile
PROMETHEUS_HOME=/usr/local/prometheus
PATH=$PATH:$PROMETHEUS_HOME
[root@VM-0-16-centos prometheus]# source /etc/profile
5、注册服务
[root@VM-0-16-centos ~]# vim /usr/lib/systemd/system/prometheus.service
[Unit]
Description=Prometheus
[Service]
ExecStart=/usr/local/prometheus/prometheus --config.file=/usr/local/prometheus/prometheus.yml --web.enable-lifecycle
Restart=on-failure
[Install]
WantedBy=multi-user.target
6、启动prometheus
[root@VM-0-16-centos ~]# systemctl daemon-reload
[root@VM-0-16-centos ~]# systemctl start prometheus
[root@VM-0-16-centos ~]# systemctl status prometheus
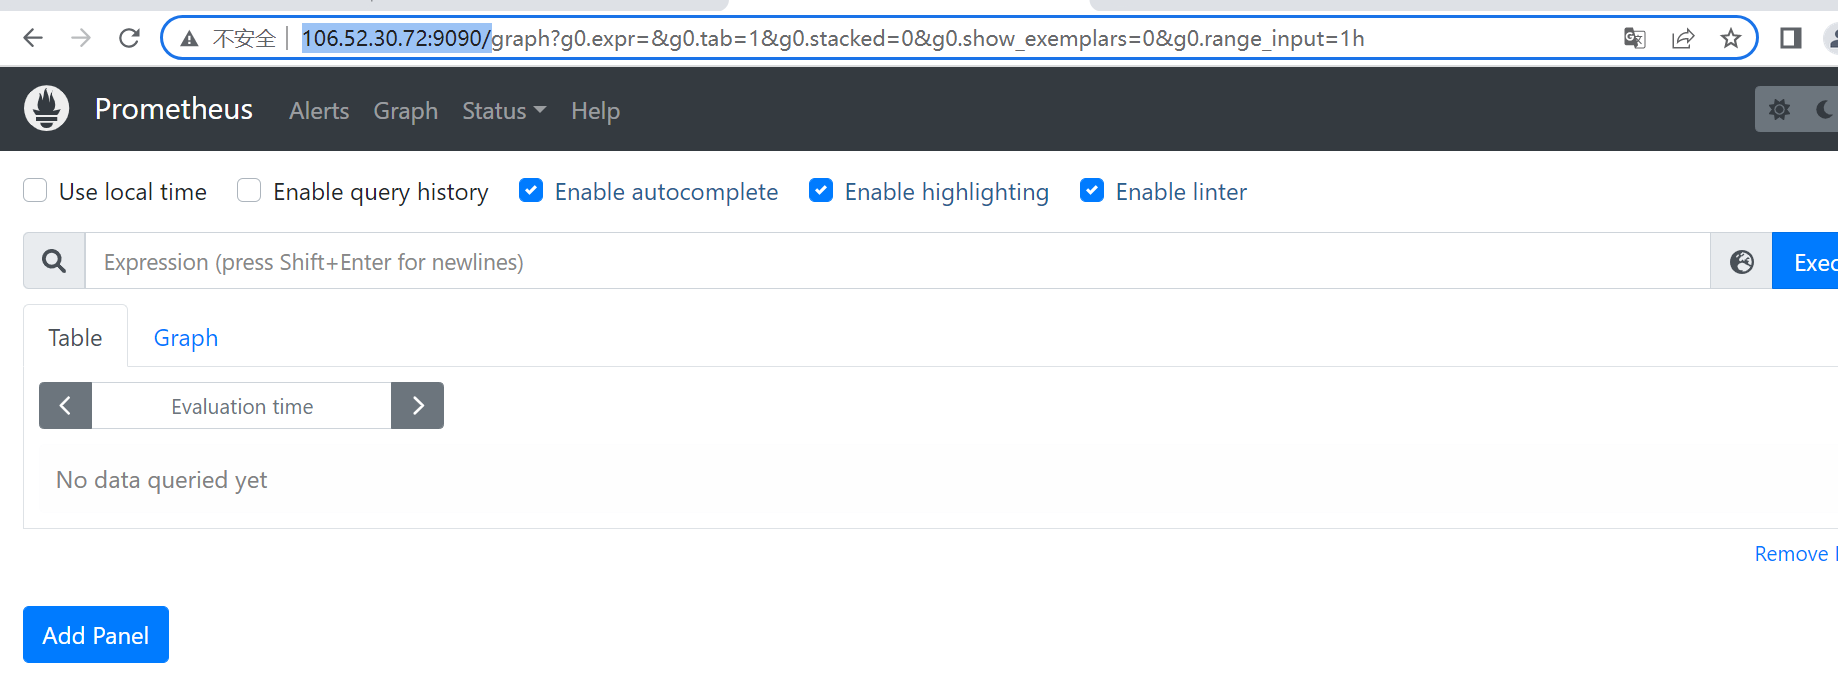
# 浏览器访问http://106.52.30.72:9090/ 进入prometheus监控:106.52.30.72为IP,9090是端口
4、Prometheus监控的方式
见图
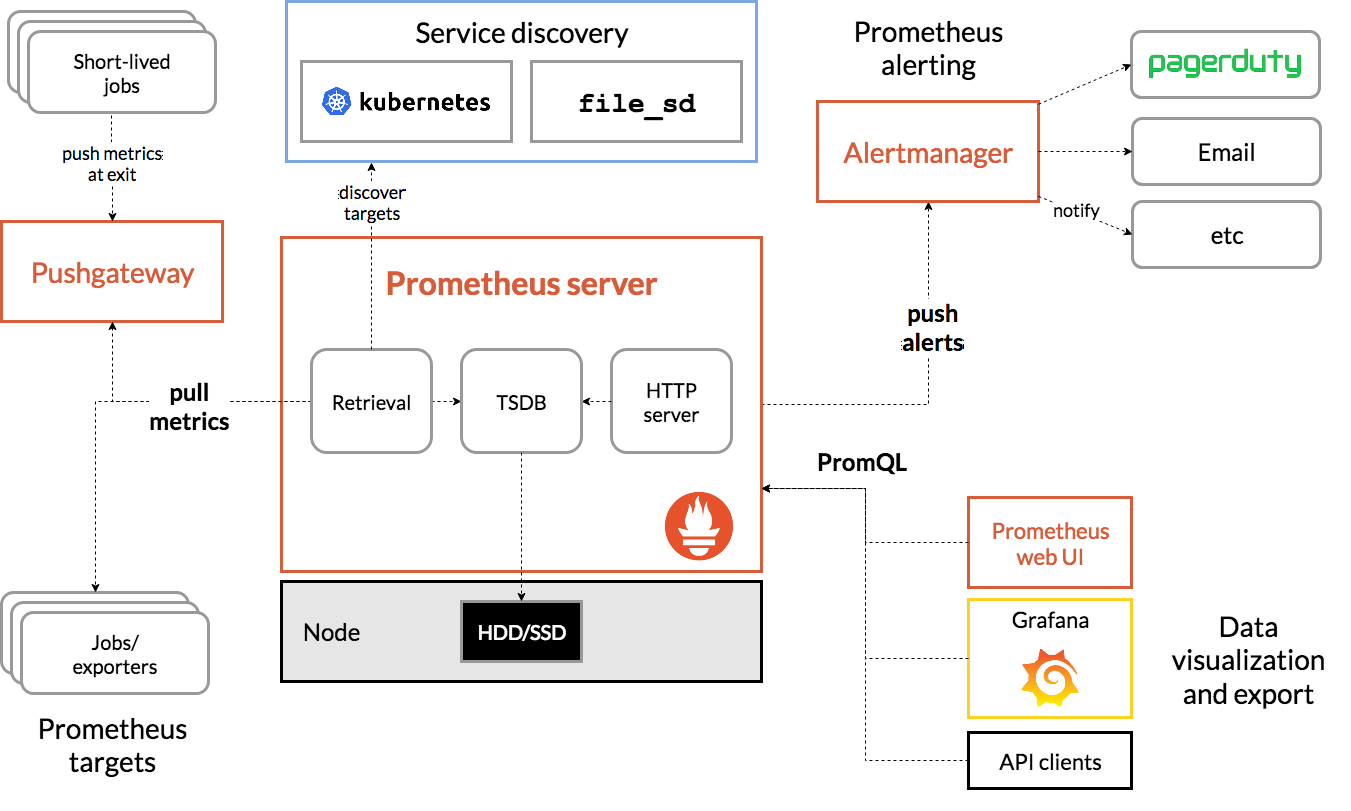
4.1、获取监控数据端
4.1.1 软件自身携带metrics接口
也就是软件在内部已经集成了metrics接口,promethes可以通过软件自身携带的metrics接口获取软件的监控数据,进而实现监控。
4.1.2 依赖Exporter插件创建metrics接口
相对于拥有metrics接口的软件而言,大多数软件是没有自带metrics接口的,那么这个时候如果需要使用prometheus来监控软件,就需要一个与之相对应的exporter插件,来为其提供一个metrics接口。
4.2 存储监控数据
对于Prometheus而言,存储监控数据的数据库是TSDB时序数据库(科普:时序数据库是一种高性能的数据库,相对于MySQL数据库而言,其速度要比MySQL数据库快N多倍,同时MySQL数据库在处理超过2000万行数据的内容时,延时非常严重,TSDB数据库处理的数据是TB级)
4.3 容器化
如果我们将Prometheus容器化了之后,那么prometheus的监控流程会有所变化。
4.4 展现数据
通常采用PromeQL(科普:PromeQL是prometheus中的SQL语言,主要是用来查询Prometheus中的监控数据的)来展示数据。
5、使用Prometheus监控Linux主机
上面我们已经说过了,Promentheus监控是需要metrics接口的。Linux主机是不携带Metrics接口的,所以我们需要部署一个Linux主机的Exporter,来为其提供一个metrics接口。
5.1 部署Node Exporter
1、下载node_exporter
[root@VM-0-16-centos ~]# wget https://github.com/prometheus/node_exporter/releases/download/v1.3.1/node_exporter-1.3.1.linux-amd64.tar.gz

2、安装
[root@VM-0-16-centos ~]# tar -xf node_exporter-1.1.2.linux-amd64.tar.gz
[root@VM-0-16-centos ~]# mv node_exporter-1.1.2.linux-amd64/node_exporter /usr/local/bin/

3、注册node-exporter服务
[root@VM-0-16-centos ~]# vim /usr/lib/systemd/system/node-exporter.service
[Unit]
Description=This is prometheus node exporter
After=node_exporter.service

[Service]
Type=simple
ExecStart=/usr/local/bin/node_exporter
ExecReload=/bin/kill -HUP
KillMode=process
Restart=on-failure

[Install]
WantedBy=multi-user.target

4、启动node-exporter
[root@VM-0-16-centos ~]# systemctl daemon-reload
[root@VM-0-16-centos ~]# systemctl start node-exporter
5.2 加入prometheus
172.16.0.4为本服务器内网IP
[root@VM-0-16-centos ~]# vim /usr/local/prometheus/prometheus.yml   # 在末尾添加,注意对齐上面一个job的格式
  - job_name: 'Node-Exporter'
    static_configs:
    - targets:
      - '172.16.0.4:9100'

[root@VM-0-16-centos ~]# systemctl restart prometheus
6、使用Prometheus监控MySQL数据库
MySQL数据库也是没有Metrices接口的。
6.1 部署MySQL Exporter
1、下载
wget https://ghproxy.com/https://github.com/prometheus/mysqld_exporter/releases/download/v0.14.0/mysqld_exporter-0.14.0.linux-amd64.tar.gz
2、解压
[root@VM-0-16-centos opt]# tar -xf mysqld_exporter-0.14.0.linux-amd64.tar.gz
[root@VM-0-16-centos opt]# mv mysqld_exporter-0.14.0.linux-amd64/mysqld_exporter /usr/local/bin/
3、安装数据库
[root@VM-0-16-centos opt]# yum install mariadb* -y
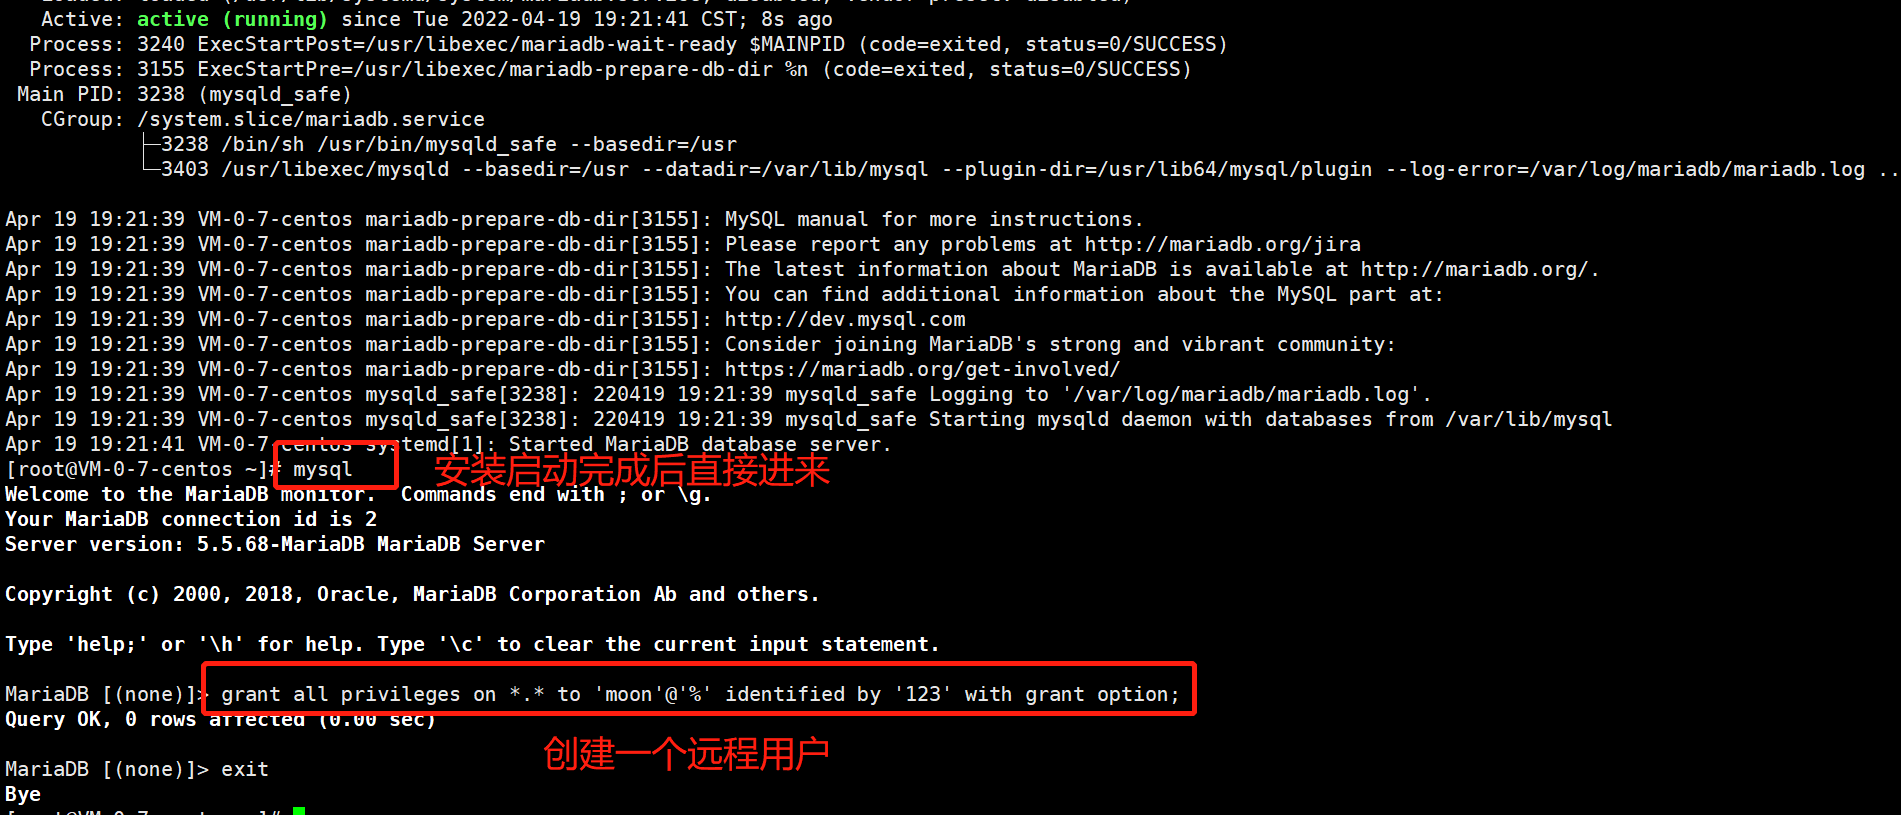
[root@VM-0-16-centos opt]# systemctl start mariadb
4、创建一个远程链接用户
[root@VM-0-16-centos opt]# mysql
MariaDB [(none)]> grant all privileges on *.* to 'moon'@'%' identified by '123' with grant option;
Query OK, 0 rows affected (0.00 sec)
MariaDB [(none)]> flush privileges;
Query OK, 0 rows affected (0.00 sec)
MariaDB [(none)]> exit
Bye
5、创建一个MySQL-Exporter的配置文件
[root@VM-0-16-centos ~]# vim /root/.my.cnf # 106.52.30.72为本机公网IP
[client]
host=106.52.30.72
user=moon
password=123
6、注册mysql-exporter服务
[root@VM-0-16-centos ~]# vim /usr/lib/systemd/system/mysqld-exporter.service
[Unit]
Description=Prometheus
[Service]
ExecStart=/usr/local/bin/mysqld_exporter --config.my-cnf=/root/.my.cnf --web.listen-address=:9104
Restart=on-failure
[Install]
WantedBy=multi-user.target
[root@VM-0-16-centos ~]# systemctl daemon-reload
[root@VM-0-16-centos ~]# systemctl start mysqld-exporter.service
[root@VM-0-16-centos ~]# systemctl status mysqld-exporter.service
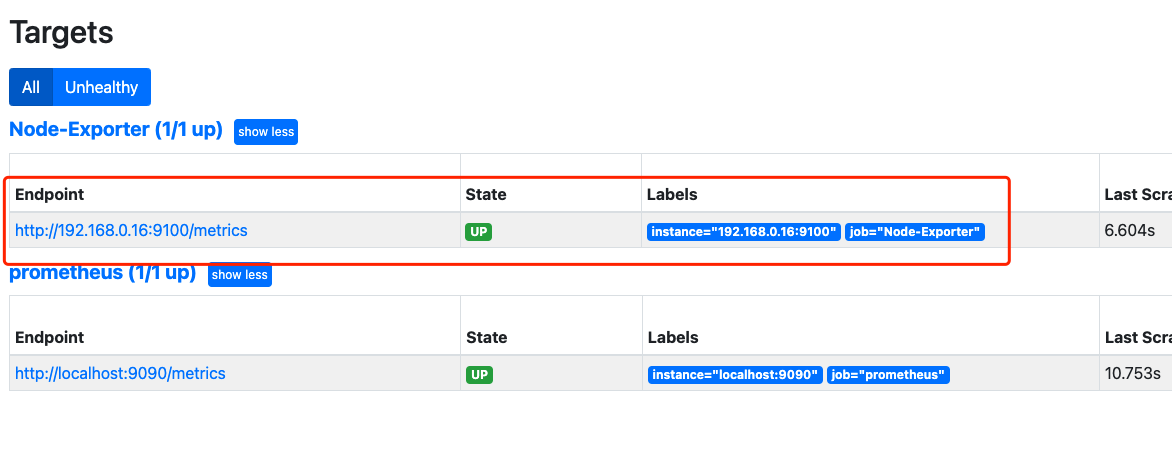
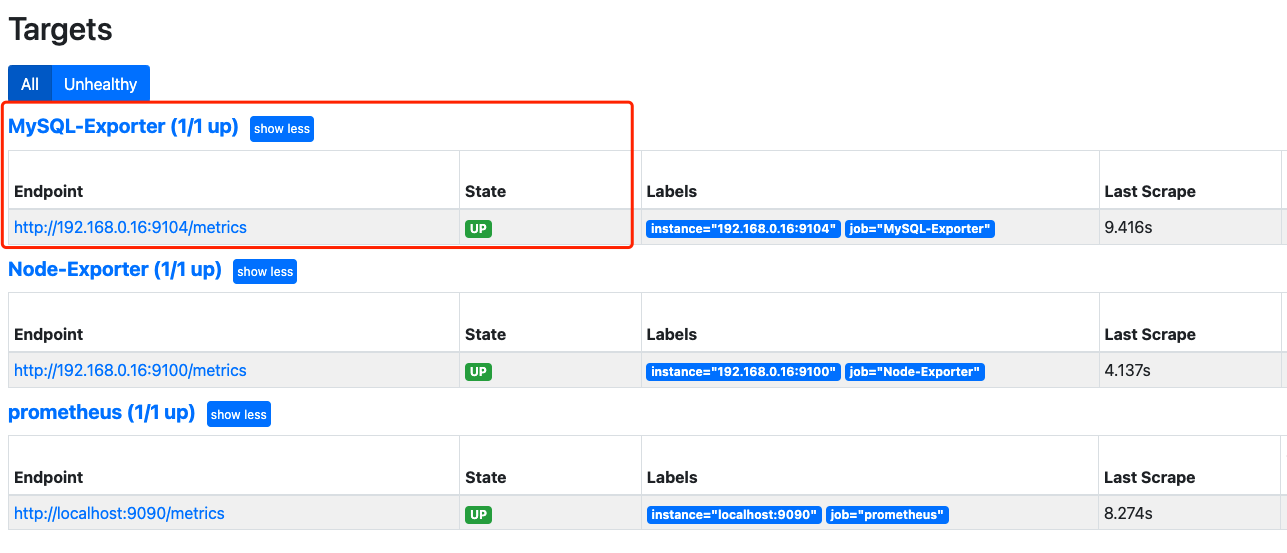
6.2 将mysql-exporter加入prometheus
172.16.0.4为本服务器内网IP
[root@VM-0-16-centos ~]# vim /usr/local/prometheus/prometheus.yml  # 写到最后,注意缩进
  - job_name: 'MySQL-Exporter'
    static_configs:
    - targets:
      - '172.16.0.4:9104'

[root@VM-0-16-centos ~]# systemctl restart prometheus

# 浏览器访问 172.16.0.4:9090进入prometheus监控的status查看监控
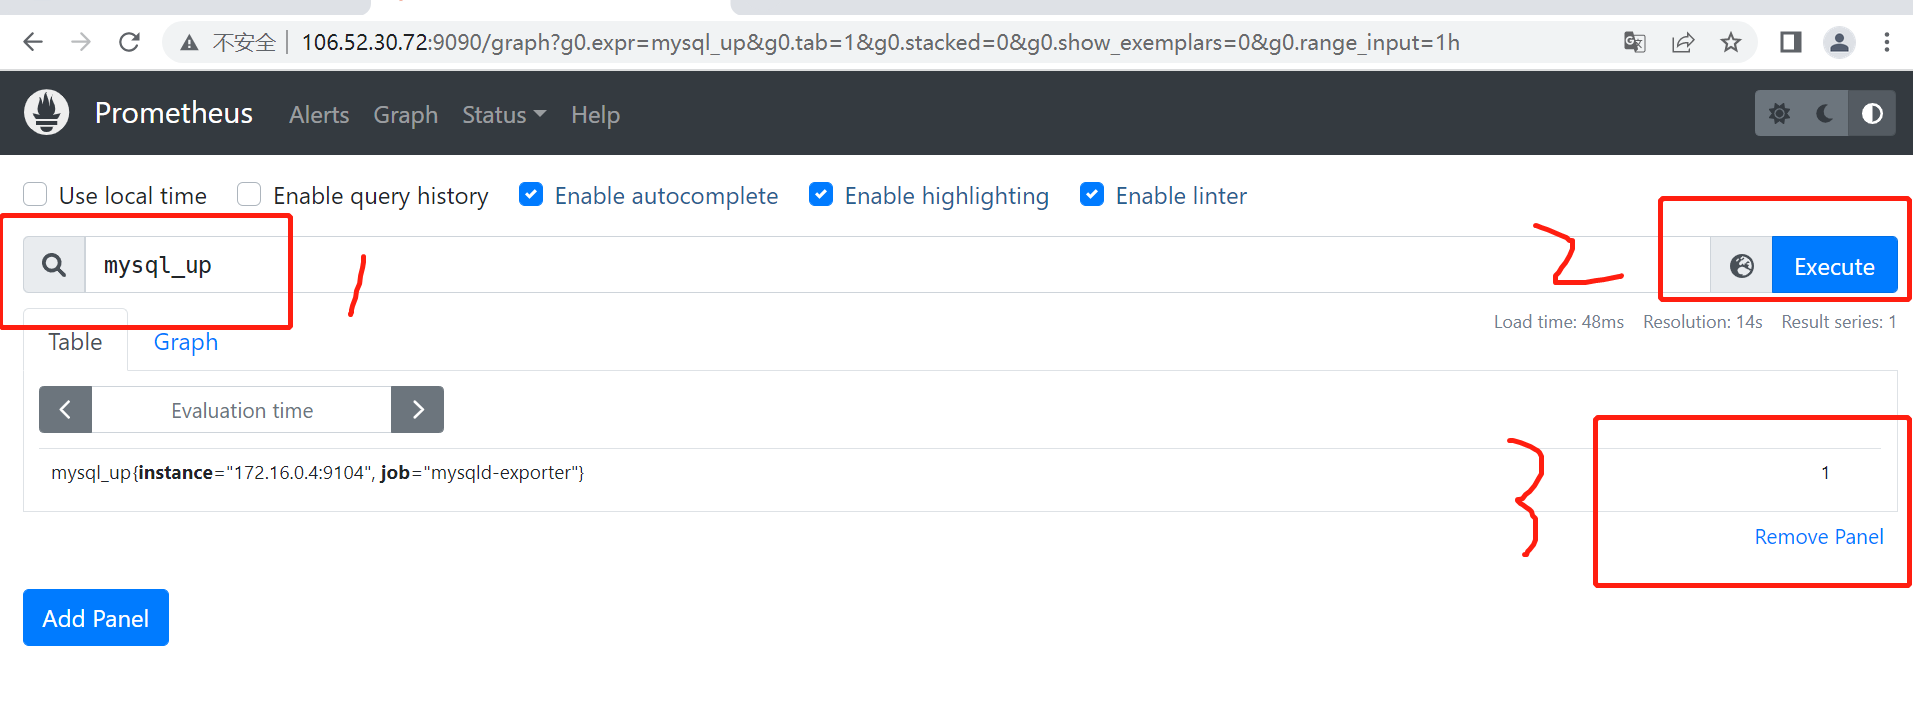
PromeQL
PromeQL相当于MySQL中的SQL,换句话说就是用来查询Prometheus中的监控数据的一种SQL语言。
1、PromeQL 基础
包含一些字符串查询,简单筛选。
1.1 字符串查询
就是根据监控项,来查询对应的监控数据。

1.2 简单的筛选
对查询出来的数据进行简单筛选。

2、PromeQL 运算
通过PromeQL来对查询出来的监控项结果进行运算

3、瞬时向量和即时向量
瞬时向量:代表的是某一个瞬间的数据。
均时向量:代表的是某一个时间段内的数据。
3.1 瞬时向量

3.2 均时向量


4、PromeQL 函数使用
平均值,总和、中位数。
4.1 求平均数avg

4.2 总和sum

4.3 平均增长率rate
单位时间内,增长的一个速率。

4.4 瞬时增长率
以单位时间内的数据,计算下一个时刻可能会增长的区间。

Prometheus的数据可视化工具grafana
Prometheus自带的数据展示页面功能比较的少,选择使用grafana数据大屏软件来展示相关的数据。
部署grafana
1、下载Grafana
[root@VM-0-16-centos ~]# wget https://mirrors.tuna.tsinghua.edu.cn/grafana/yum/rpm/grafana-8.4.6-1.x86_64.rpm

2、安装
[root@VM-0-16-centos ~]# yum install grafana-8.4.6-1.x86_64.rpm  -y

3、启动
[root@VM-0-16-centos ~]# systemctl start grafana-server

4、测试是否启动
# 默认的用户名和密码全部都是:admin


AlertManager
Prometheus中的报警组件。
1、获取数据通过Metrics接口。
2、TSDB用来存储监控数据。
3、Grafana展示监控大屏。
4、AlterManager用作监控报警的组件。
1、AlertManager的组成
● 1、AlterManager的报警路由
● 2、报警的模板
○ 邮件报警的模板
● 3、报警的规则
2、AlertManager部署
1、压缩
[root@VM-0-16-centos ~]# wget https://ghproxy.com/https://github.com/prometheus/alertmanager/releases/download/v0.24.0/alertmanager-0.24.0.linux-amd64.tar.gz

2、解压
[root@VM-0-16-centos ~]# tar -xf alertmanager-0.24.0.linux-amd64.tar.gz -C /usr/local/

3、创建软连接
[root@VM-0-16-centos alertmanager]# ln -s /usr/local/alertmanager-0.24.0.linux-amd64 /usr/local/alertmanager

4、添加环境变量
[root@VM-0-16-centos alertmanager]# vim /etc/profile
ALTERMANAGER_HOME=/usr/local/alertmanager
PATH=$PATH:$ALTERMANAGER_HOME
[root@VM-0-16-centos alertmanager]# source /etc/profile

5、测试启动(可以跳过)
[root@VM-0-16-centos local]# /usr/local/alertmanager/alertmanager --config.file="/usr/local/alertmanager/alertmanager.yml"

6、注册alertManager服务
[root@VM-0-16-centos local]# cat alertmanager.service
[Unit]
Description=AlertManager

[Service]
ExecStart=/usr/local/alertmanager/alertmanager --config.file=/usr/local/alertmanager/alertmanager.yml
Restart=on-failure

[Install]
WantedBy=multi-user.target

7、启动alertmanager
[root@VM-0-16-centos local]# systemctl daemon-reload
[root@VM-0-16-centos local]# systemctl start alertmanager.service
[root@VM-0-16-centos local]# systemctl status alertmanager.service


3、介绍AlertManager的配置文件
配置文档模板详情参考:https://prometheus.io/docs/alerting/latest/configuration/#receiver
# 完整配置,各个配置项的相关解释见下面各标题
[root@VM-0-4-centos ~]# vim /usr/local/alertmanager/alertmanager.yml

global:
  resolve_timeout: 3s
  smtp_smarthost: 'smtp.163.com:465'
  smtp_from: 'chenya@163.com'
  smtp_auth_username: 'chegqit@163.com'
  smtp_auth_password: 'YBCWWQHKFPK'
  smtp_require_tls: false

route:
  group_by: ['alertname', 'dev', 'instance']
  group_wait: 30s
  group_interval: 2m
  repeat_interval: 3m
  receiver: 'email'

receivers:
  - name: 'web.hook'
    webhook_configs:
      - url: 'http://127.0.0.1:5001/'
  - name: 'email'
    email_configs:
      - to: 'cheqit@163.com'
        html: ''
        send_resolved: true

inhibit_rules:
  - source_match:
      severity: 'critical'
    target_match:
      severity: 'warning'
    equal: ['alertname', 'dev', 'instance']
3.1 全局配置
# global:全局配置,主要配置告警方式,如邮件、webhook等。
global:
  resolve_timeout: 5m	# 超时,默认5min,意思是说报警持续多长时间才发信息
  smtp_smarthost: ''	# 这里为 QQ 邮箱 SMTP 服务地址,官方地址为 smtp.qq.com 端口为 465 或 587,同时要设置开启 POP3/SMTP 服务。
  smtp_from: ''
  smtp_auth_username: ''
  smtp_auth_password: ''	# 这里为第三方登录 QQ 邮箱的授权码,非 QQ 账户登录密码,否则会报错,获取方式在 QQ 邮箱服务端设置开启 POP3/SMTP 服务时会提示。
  smtp_require_tls: false	# 是否使用 tls,根据环境不同,来选择开启和关闭。如果提示报错 email.loginAuth failed: 530 Must issue a STARTTLS command first,那么就需要设置为 true。着重说明一下,如果开启了 tls,提示报错 starttls failed: x509: certificate signed by unknown authority,需要在 email_configs 下配置 insecure_skip_verify: true 来跳过 tls 验证。


global:
  resolve_timeout: 3s
  smtp_smarthost: 'smtp.163.com:465'
  smtp_from: 'chqit@163.com'
  smtp_auth_username: 'chet@163.com'
  smtp_auth_password: 'YKFPKSHAKDYADBHSAK'
  smtp_require_tls: false
3.2 路由配置
用来设置报警的分发策略。
# route:用来设置报警的分发策略。Prometheus的告警先是到达alertmanager的根路由(route),alertmanager的根路由不能包含任何匹配项,因为根路由是所有告警的入口点。
# 另外,根路由需要配置一个接收器(receiver),用来处理那些没有匹配到任何子路由的告警(如果没有配置子路由,则全部由根路由发送告警),即缺省
# 接收器。告警进入到根route后开始遍历子route节点,如果匹配到,则将告警发送到该子route定义的receiver中,然后就停止匹配了。因为在route中
# continue默认为false,如果continue为true,则告警会继续进行后续子route匹配。如果当前告警仍匹配不到任何的子route,则该告警将从其上一级(
# 匹配)route或者根route发出(按最后匹配到的规则发出邮件)。查看你的告警路由树,https://www.prometheus.io/webtools/alerting/routing-tree-editor/,
# 将alertmanager.yml配置文件复制到对话框,然后点击"Draw Routing Tree"
route:
  group_by: ['alertname']	# 用于分组聚合,对告警通知按标签(label)进行分组,将具有相同标签或相同告警名称(alertname)的告警通知聚合在一个组,然后作为一个通知发送。如果想完全禁用聚合,可以设置为group_by: [...]
  group_wait: 30s	# 当一个新的告警组被创建时,需要等待'group_wait'后才发送初始通知。这样可以确保在发送等待前能聚合更多具有相同标签的告警,最后合并为一个通知发送。
  group_interval: 2m	# 当第一次告警通知发出后,在新的评估周期内又收到了该分组最新的告警,则需等待'group_interval'时间后,开始发送为该组触发的新告警,可以简单理解为,group就相当于一个通道(channel)。
  repeat_interval: 10m	# 告警通知成功发送后,若问题一直未恢复,需再次重复发送的间隔。
  receiver: 'email'		#  配置告警消息接收者,与下面配置的对应。例如常用的 email、wechat、slack、webhook 等消息通知方式。
  routes:	# 子路由
  - receiver: 'wechat'
    match:	# 通过标签去匹配这次告警是否符合这个路由节点;也可以使用  match_re 进行正则匹配
      severity: Disaster	# 标签severity为Disaster时满足条件,使用wechat警报
3.3 通知配置
receivers:	# 配置报警信息接收者信息。
- name: 'email'	# 警报接收者名称
  email_configs:
  - to: '{{ template "email.to"}}'  # 接收警报的email(这里是引用模板文件中定义的变量)
    html: '{{ template "email.to.html" .}}' # 发送邮件的内容(调用模板文件中的)
#    headers: { Subject: " {{ .CommonLabels.instance }} {{ .CommonAnnotations.summary }}" }	# 邮件标题,不设定使用默认的即可
    send_resolved: true		# 故障恢复后通知


receivers:
  - name: 'email'
    email_configs:
      - to: '{{ template "email.to" . }}'
        html: '{{ template "email.to.html" . }}'
        send_resolved: true
3.4 抑制规则配置
inhibit_rules:		# 抑制规则配置,当存在与另一组匹配的警报(源)时,抑制规则将禁用与一组匹配的警报(目标)。
  - source_match:
      severity: 'critical'
    target_match:
      severity: 'warning'
    equal: ['alertname', 'dev', 'instance']

# 如果不配置抑制规则,那么假设CPU达到100%, 每到一个阶段就报警一次,显得有些冗余
100%   --- > 警告 | 严重警告 | error  # 报警3次

CPU
  60 %  : 警告
  80 %  : 严重警告
  100%  : error
4、报警模板
报警的时候,发送邮件的格式。
4.1 编写模板
[root@VM-0-16-centos alertmanager]# mkdir /usr/local/alertmanager/templates
[root@VM-0-16-centos alertmanager]# vim /usr/local/alertmanager/templates/test.tmpl
{{ define "email.from" }}chenyangqit@163.com{{ end }}
{{ define "email.to" }}chenyangqit@163.com{{ end }}
{{ define "email.to.html" }}
{{- if gt (len .Alerts.Firing) 0 -}}{{ range .Alerts }}
<h2>@告警通知</h2>
告警程序: prometheus_alert <br>
告警级别: {{ .Labels.severity }} 级 <br>
告警类型: {{ .Labels.alertname }} <br>
故障主机: {{ .Labels.instance }} <br>
告警主题: {{ .Annotations.summary }} <br>
告警详情: {{ .Annotations.description }} <br>
触发时间: {{ .StartsAt.Local.Format "2006-01-02 15:04:05" }} <br>
{{ end }}{{ end -}}
{{- if gt (len .Alerts.Resolved) 0 -}}{{ range .Alerts }}
<h2>@告警恢复</h2>
告警程序: prometheus_alert <br>
故障主机: {{ .Labels.instance }}<br>
故障主题: {{ .Annotations.summary }}<br>
告警详情: {{ .Annotations.description }}<br>
告警时间: {{ .StartsAt.Local.Format "2006-01-02 15:04:05" }}<br>
恢复时间: {{ .EndsAt.Local.Format "2006-01-02 15:04:05" }}<br>
{{ end }}{{ end -}}
{{- end }}
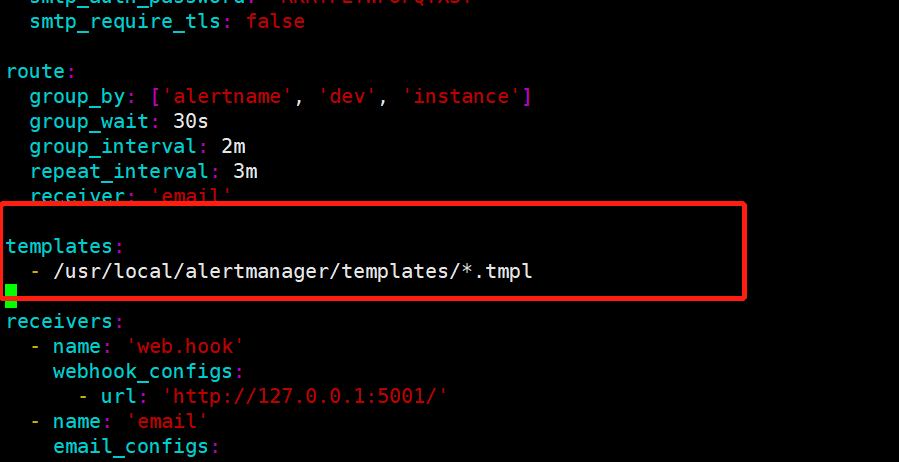
4.2 加入到配置文件之中
[root@VM-0-16-centos alertmanager]# vim /usr/local/alertmanager/alertmanager.yml  # 把以下配置添加到文件中
templates:
  - /usr/local/alertmanager/templates/*.tmpl
5、报警的规则
告诉alertmanager,什么时候报警。
5.1 完整的报警规则配置
[root@VM-0-16-centos rules]# mkdir /usr/local/alertmanager/rules
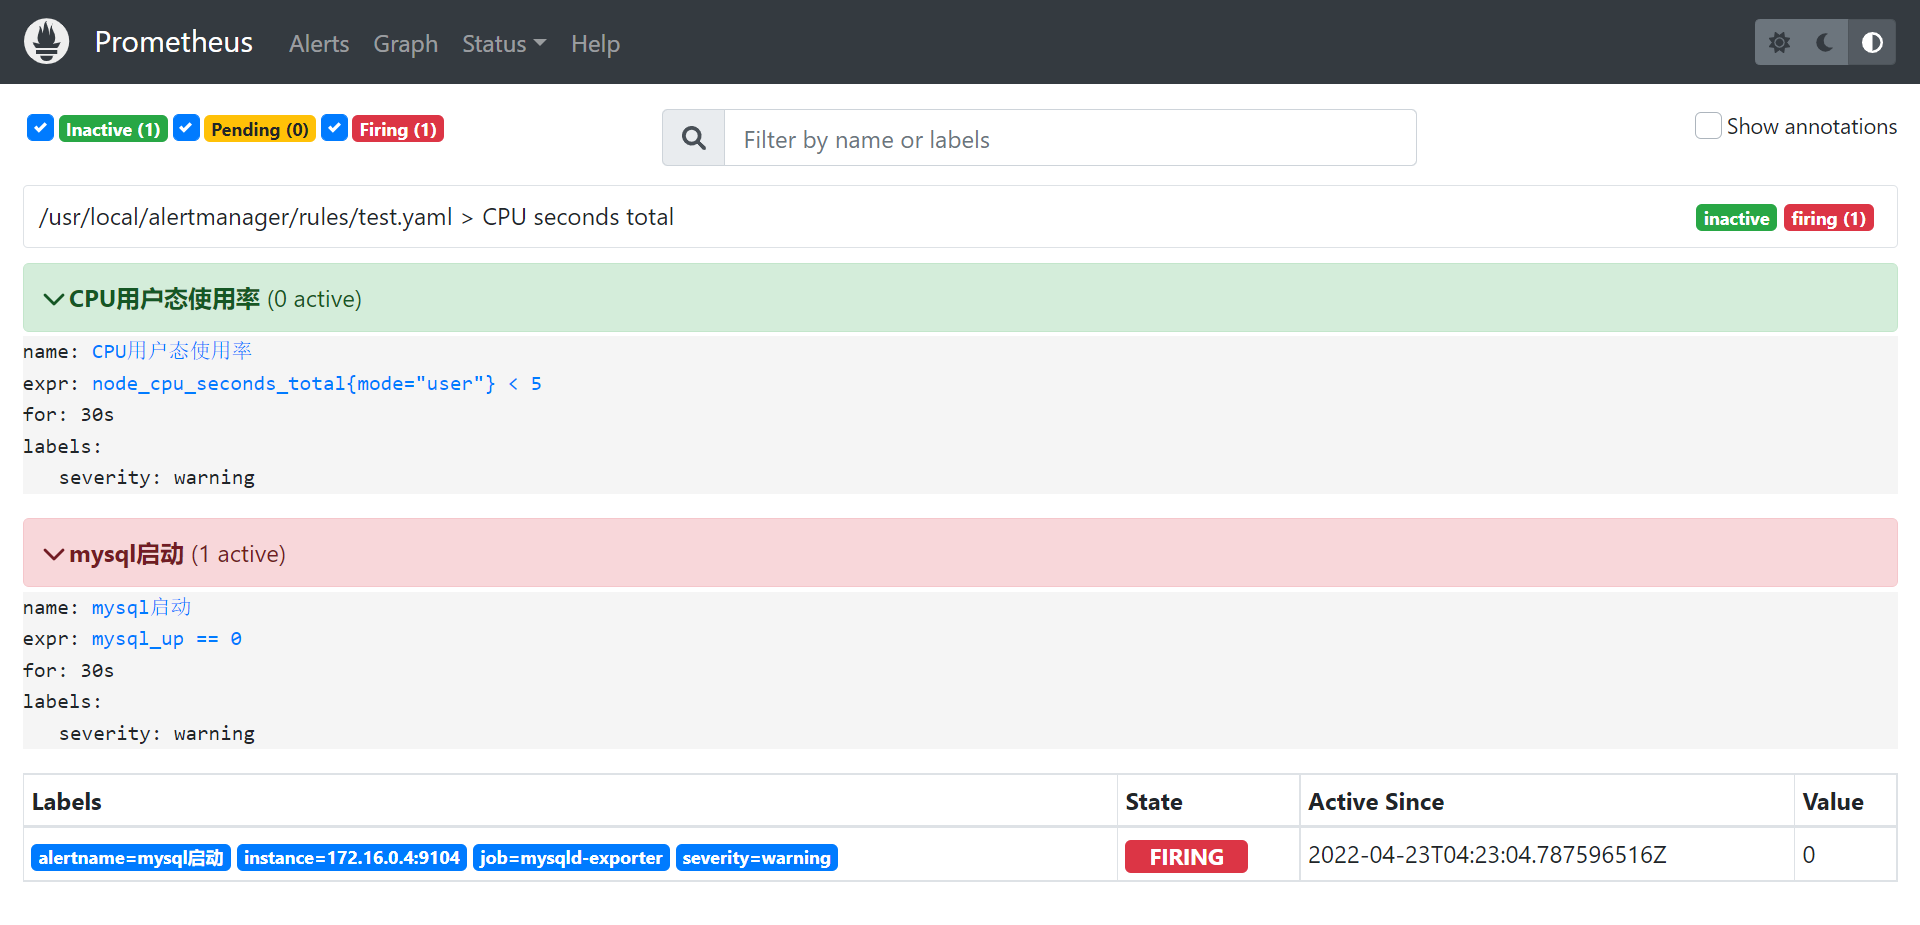
[root@VM-0-16-centos rules]# cat /usr/local/alertmanager/rules/test.yaml
groups:
- name: CPU seconds total
rules:
- alert: CPU用户态使用率
expr: node_cpu_seconds_total{mode="user"} < 5
for: 30s
labels:
severity: warning
- alert: mysql启动
expr: mysql_up == 0
for: 30s
labels:
severity: warning
5.2 报警规则解释
groups:
- name: cpu
  rules:
  - record: node:cpu_usage:ratio # 别的文件使用,直接使用这个
    expr: ((100 - (avg by(instance,ip,hostname) (irate(node_cpu_seconds_total{mode="idle"}[5m])) * 100)))
- name: mem
  rules:
  - record: node:memory_usage:ratio
    expr: (100 -(node_memory_MemTotal_bytes -node_memory_MemFree_bytes+node_memory_Buffers_bytes+node_memory_Cached_bytes ) / node_memory_MemTotal_bytes * 100 )
    annotations:
      description: "The node is Down more than 1 minute!"
      summary:  "The  node is  down"


groups:	分组,因为会有很多指标需要做告警
name:	报警规则的名字
alert: 告警规则的名称,在每一个group中,规则名称必须是唯一的。
expr: 报警表达式:基于PromQL表达式配置的规则条件,用于计算相关的时间序列指标是否满足规则。
for :评估等待时间,可选参数。当相关指标触发规则后,在for定义的时间区间内该规则会处于Pending状态,在达到该时间后规则状态变成Firing,并发送告警信息到Alertmanager。
labels: 自定义标签, 允许用户指定要添加到告警信息上的一组附加标签。
annotations: 用于指定一组附加信息,如用于描述告警的信息文字等,本示例中 summary用于描述主要信息,description用于描述详细的告警内容。

监控CPU使用率的报警规则
监控内存的报警规则
6、将报警规则和alertmanager加入到porometheus
6.1 修改prometheus的配置文件
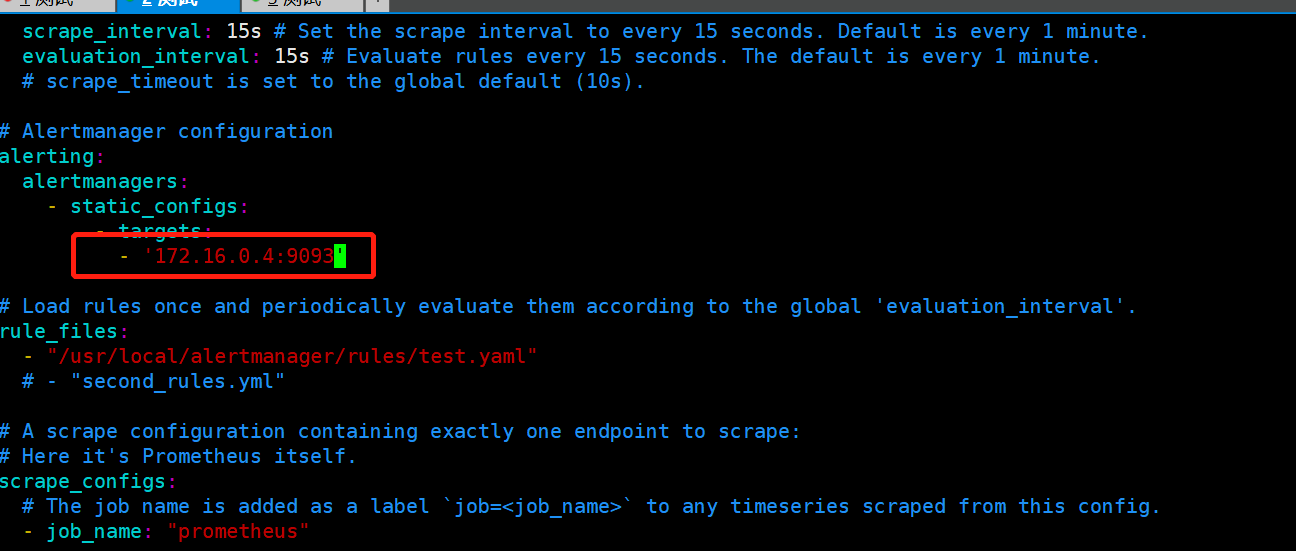
[root@VM-0-16-centos prometheus]# vim /usr/local/prometheus/prometheus.yml  # 修改以下配置,如果部署在同一台机器可以配内网IP会比较快

# Alertmanager configuration
alerting:
  alertmanagers:
  - static_configs:
    - targets:
        - 106.55.248.161:9093
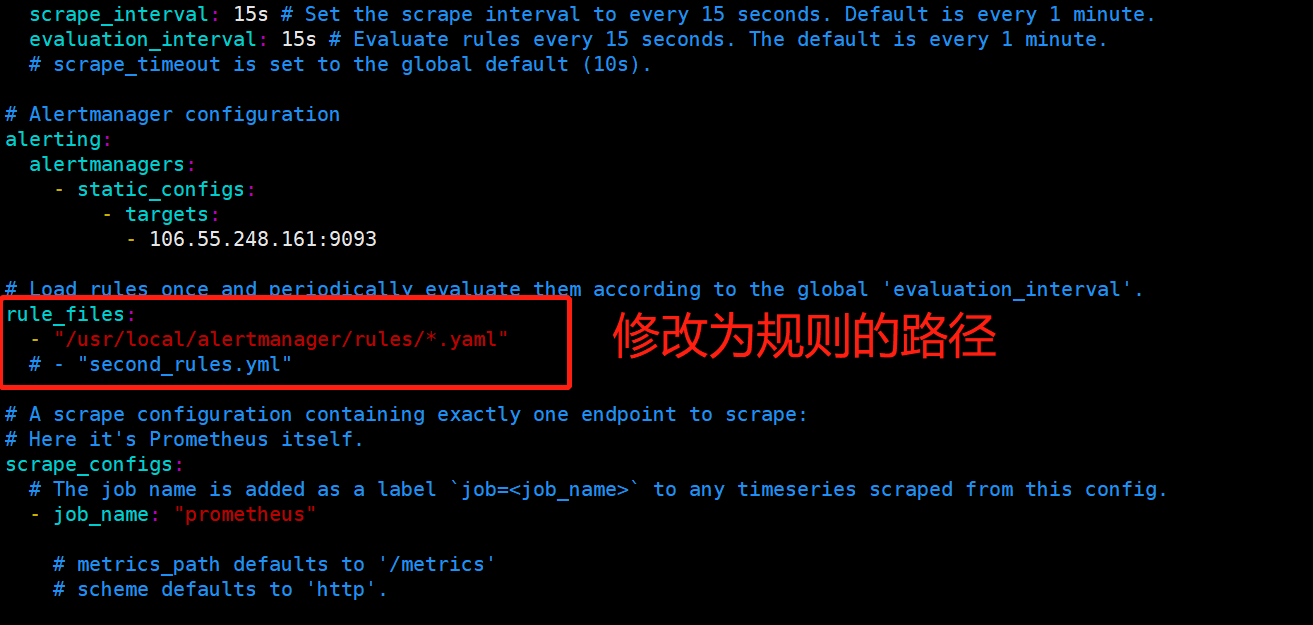
6.2 将报警规则加入prometheus
[root@VM-0-16-centos prometheus]# vim /usr/local/prometheus/prometheus.yml
rule_files:
  - "/usr/local/alertmanager/rules/test.yaml"
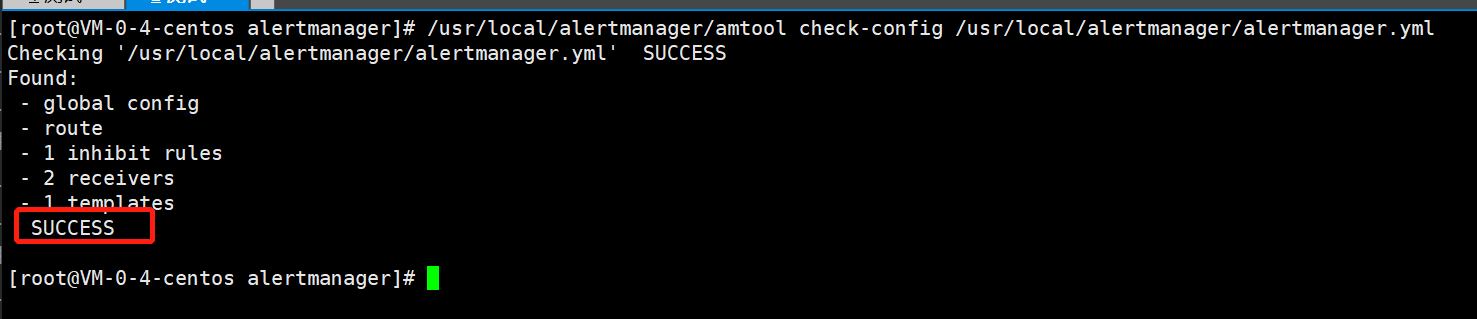
6.3 检查alertmanagerg和rules的配置文件是否正确
[root@VM-0-16-centos prometheus]# /usr/local/alertmanager/amtool check-config /usr/local/alertmanager/alertmanager.yml
Checking '/usr/local/alertmanager/alertmanager.yml' SUCCESS
Found:
- global config
- route
- 1 inhibit rules
- 1 receivers
- 1 templates
SUCCESS
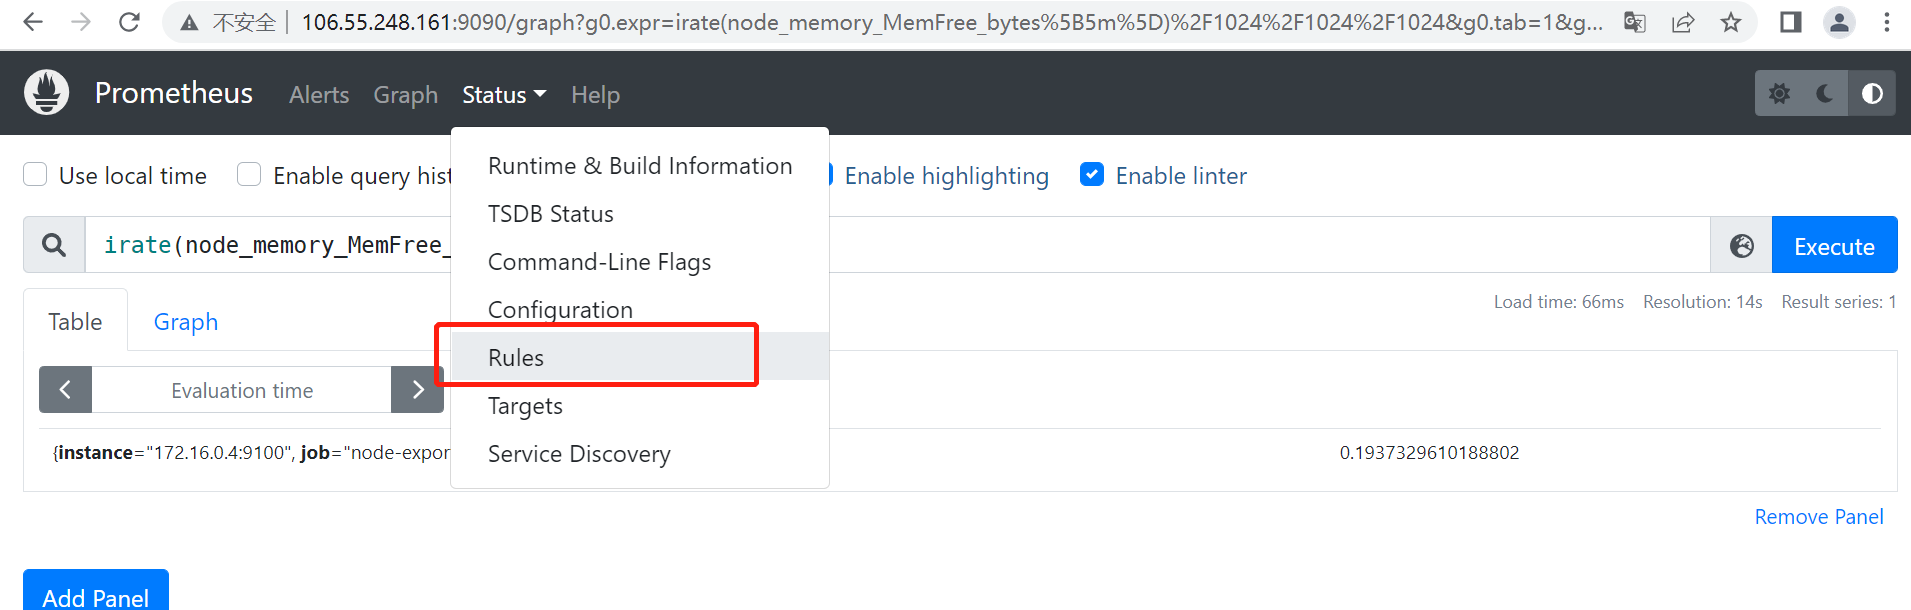
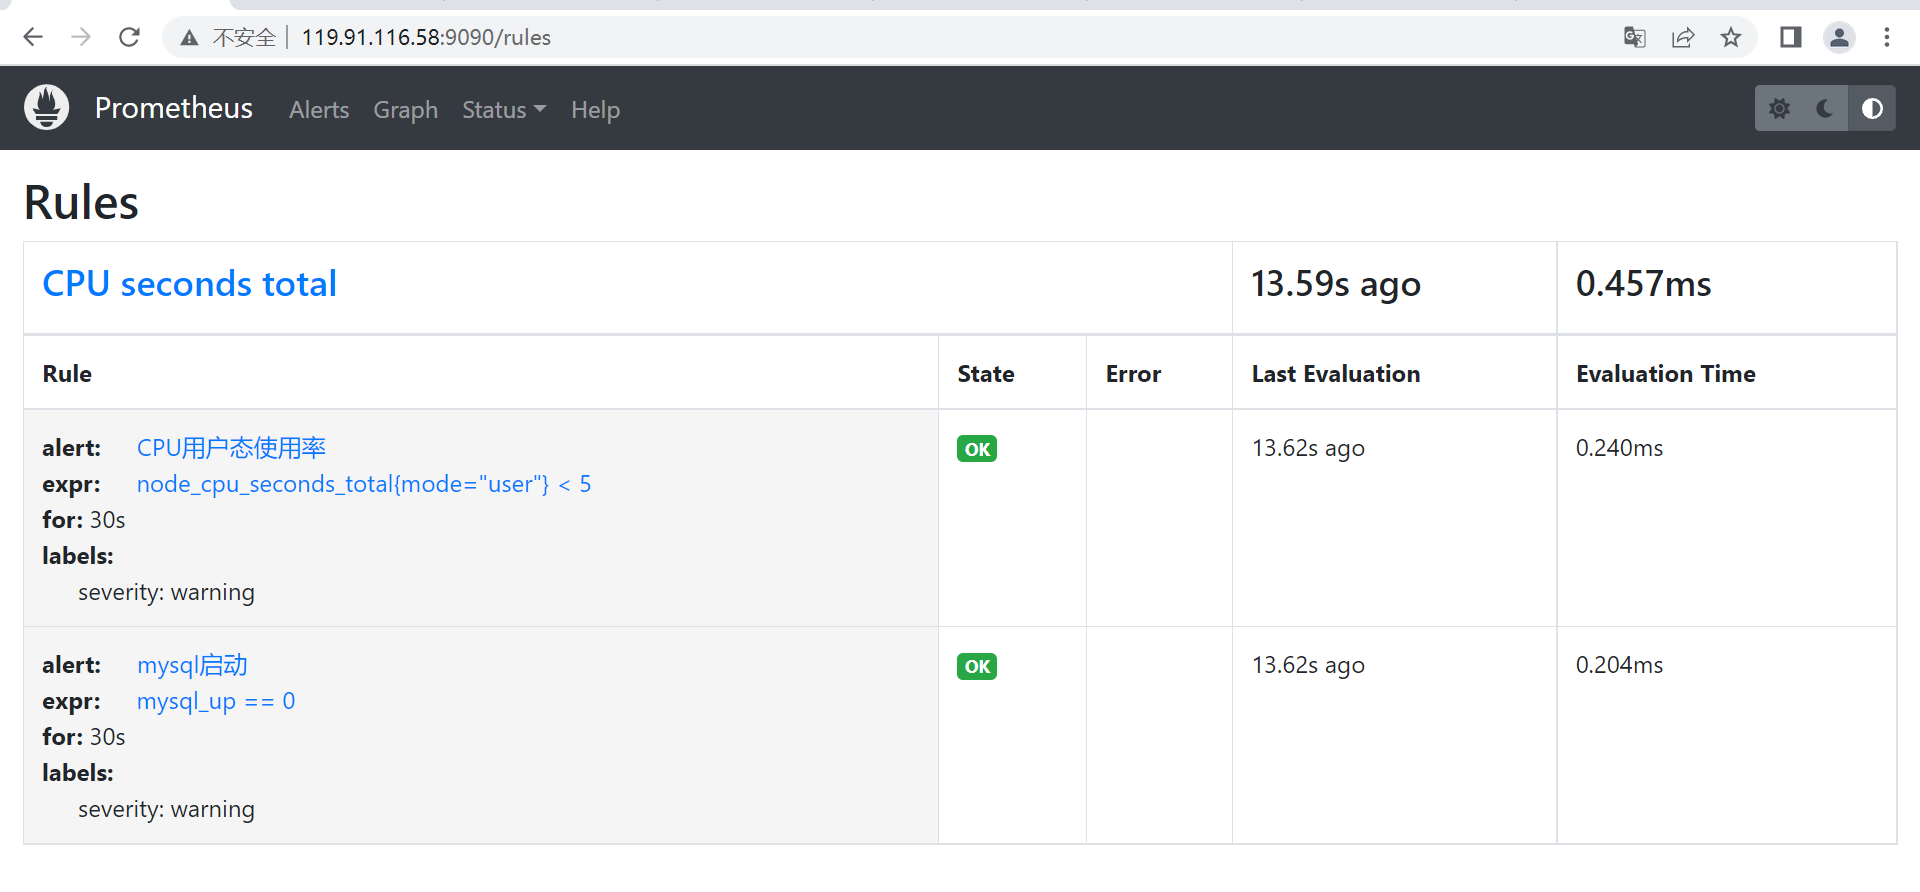
# 重启prometheus
[root@VM-0-4-centos alertmanager]# systemctl restart prometheus.service
# 刷新web端,菜单栏status中看 rules 查看刚刚配置的规则


【推荐】国内首个AI IDE,深度理解中文开发场景,立即下载体验Trae
【推荐】编程新体验,更懂你的AI,立即体验豆包MarsCode编程助手
【推荐】抖音旗下AI助手豆包,你的智能百科全书,全免费不限次数
【推荐】轻量又高性能的 SSH 工具 IShell:AI 加持,快人一步
· DeepSeek 开源周回顾「GitHub 热点速览」
· 物流快递公司核心技术能力-地址解析分单基础技术分享
· .NET 10首个预览版发布:重大改进与新特性概览!
· AI与.NET技术实操系列(二):开始使用ML.NET
· 单线程的Redis速度为什么快?