RGB2HSV Python
RGB2HSV Python
from skimage import color
import matplotlib.pyplot as plt
import cv2
img=cv2.imread('low-light.jpg')
print(img.shape)
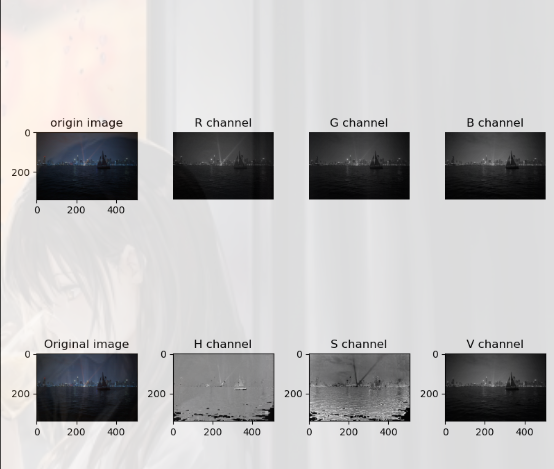
plt.figure(num='astronaut',figsize=(8,8))
plt.subplot(2,4,1)
plt.title('origin image')
plt.imshow(img)
plt.subplot(2,4,2)
plt.title('R channel')
plt.imshow(img[:,:,0],plt.cm.gray)
plt.axis('off')
plt.subplot(2,4,3)
plt.title('G channel')
plt.imshow(img[:,:,1],plt.cm.gray)
plt.axis('off')
plt.subplot(2,4,4)
plt.title('B channel')
plt.imshow(img[:,:,2],plt.cm.gray)
plt.axis('off')
# ---------------RGB2HSV--------------------------#
hsv = color.rgb2hsv(img)
print(hsv.shape)
plt.subplot(2,4,5)
plt.imshow(img)
plt.title("Original image")
plt.subplot(2,4,6)
plt.imshow(hsv[:, :, 0], cmap=plt.cm.gray)
plt.title("H channel")
plt.subplot(2,4,7)
plt.imshow(hsv[:, :, 1], cmap=plt.cm.gray)
plt.title("S channel")
plt.subplot(2,4,8)
plt.imshow(hsv[:, :, 2], cmap=plt.cm.gray)
plt.title("V channel")
plt.show()
转载:https://blog.csdn.net/dongbao520/article/details/117200665


 浙公网安备 33010602011771号