
python利用matplot绘制横向条形图,并调整每个条形的位置
通过color_x和t_x控制每个条形的颜色和文本,draw_mybar里的y和left可以控制条形显示的位置。
import matplotlib.pyplot as plt
import numpy as np

# 数据设置
categories = ["A","B","C","D"]


color_1= "#9dc3e4"
color_2= "#f8cbbd"
color_3= "#c6e0c4"
color_4= "#f0bfbf"
t_1= "ALP"
t_2= "BET"
t_3= "GAM"
t_4= "DEL"
# 每个条形的颜色

# 条形图的位置
y = [0.3,0.6,0.9,1.2]

# 创建一个新的图形
fig, ax = plt.subplots(figsize=(8, 4))

# 绘制每个部分的条形图
# color也可以是数组

# 在条形图上添加文本标注

def add_labels(bars, values):
    for bar, value in zip(bars, values):
        width = bar.get_width()  # 条形的宽度
        start_pos = bar.get_x()  # 条形的起始位置
        center_x = start_pos + width / 2  # 计算条形的中心位置
        center_y = bar.get_y() + bar.get_height() / 2  # 计算条形的中心位置(垂直方向)
        ax.text(center_x, center_y, f'{value}', ha='center', va='center', color='black', fontsize=13)
        # print(bar,value)

def draw_mybar(y,width,my_color,label,left=0,my_height=0.2):
    temp_bar=ax.barh(y,width,height=my_height,color=my_color,label=label,left=left)
    add_labels(temp_bar,[label])
    return temp_bar
# 在指定位置绘制,并为每个部分添加标签;y控制纵坐标,left控制左偏移(即横坐标)

# 要用[] {花括号是set不是array!!!Python这个坑有点...}
draw_mybar(y[3], 8, color_1, t_1, left=0)
draw_mybar(y[0], 8, color_4, t_4, left=16)
draw_mybar(y[2], 8, color_3, t_3, left=4)
draw_mybar(y[1], 8, color_2, t_2, left=12)


draw_mybar(y[3], 2, color_4, t_4, left=8)
draw_mybar(y[3], 2, color_2, t_2, left=10)
draw_mybar(y[3], 2, color_3, t_3, left=12)

draw_mybar(y[2], 2, color_1, t_1, left=12)
draw_mybar(y[2], 2, color_4, t_4, left=0)
draw_mybar(y[2], 2, color_2, t_2, left=2)

draw_mybar(y[1], 2, color_3, t_3, left=0)
draw_mybar(y[1], 2, color_1, t_1, left=8)
draw_mybar(y[1], 2, color_4, t_4, left=10)

draw_mybar(y[0], 2, color_2, t_2, left=0)
draw_mybar(y[0], 2, color_3, t_3, left=2)
draw_mybar(y[0], 2, color_1, t_1, left=10)


# 设置标签和标题
ax.set_yticks(y)
ax.set_yticklabels(categories)
ax.set_xlabel('time')
ax.set_title('')
# 只保留左边和下方的边框,去掉右边和上方的边框
ax.spines['top'].set_visible(False)
ax.spines['right'].set_visible(False)
ax.set_xlim(0, 26)


# 显示图例
# ax.legend()
# 获取 X 轴的刻度坐标

# 显示图形
plt.show()
效果: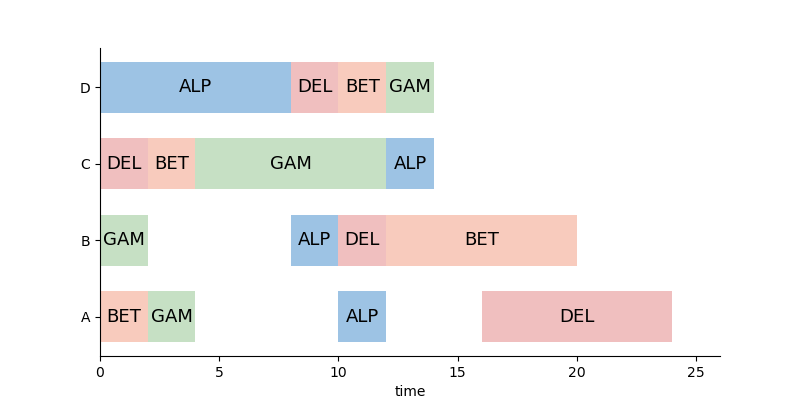
草稿,未完待续...
本文来自博客园,作者:JessieLin,转载请注明原文链接:https://www.cnblogs.com/6543x1/p/18410532

 浙公网安备 33010602011771号