63.指标监控-Boot Admin Server

简介
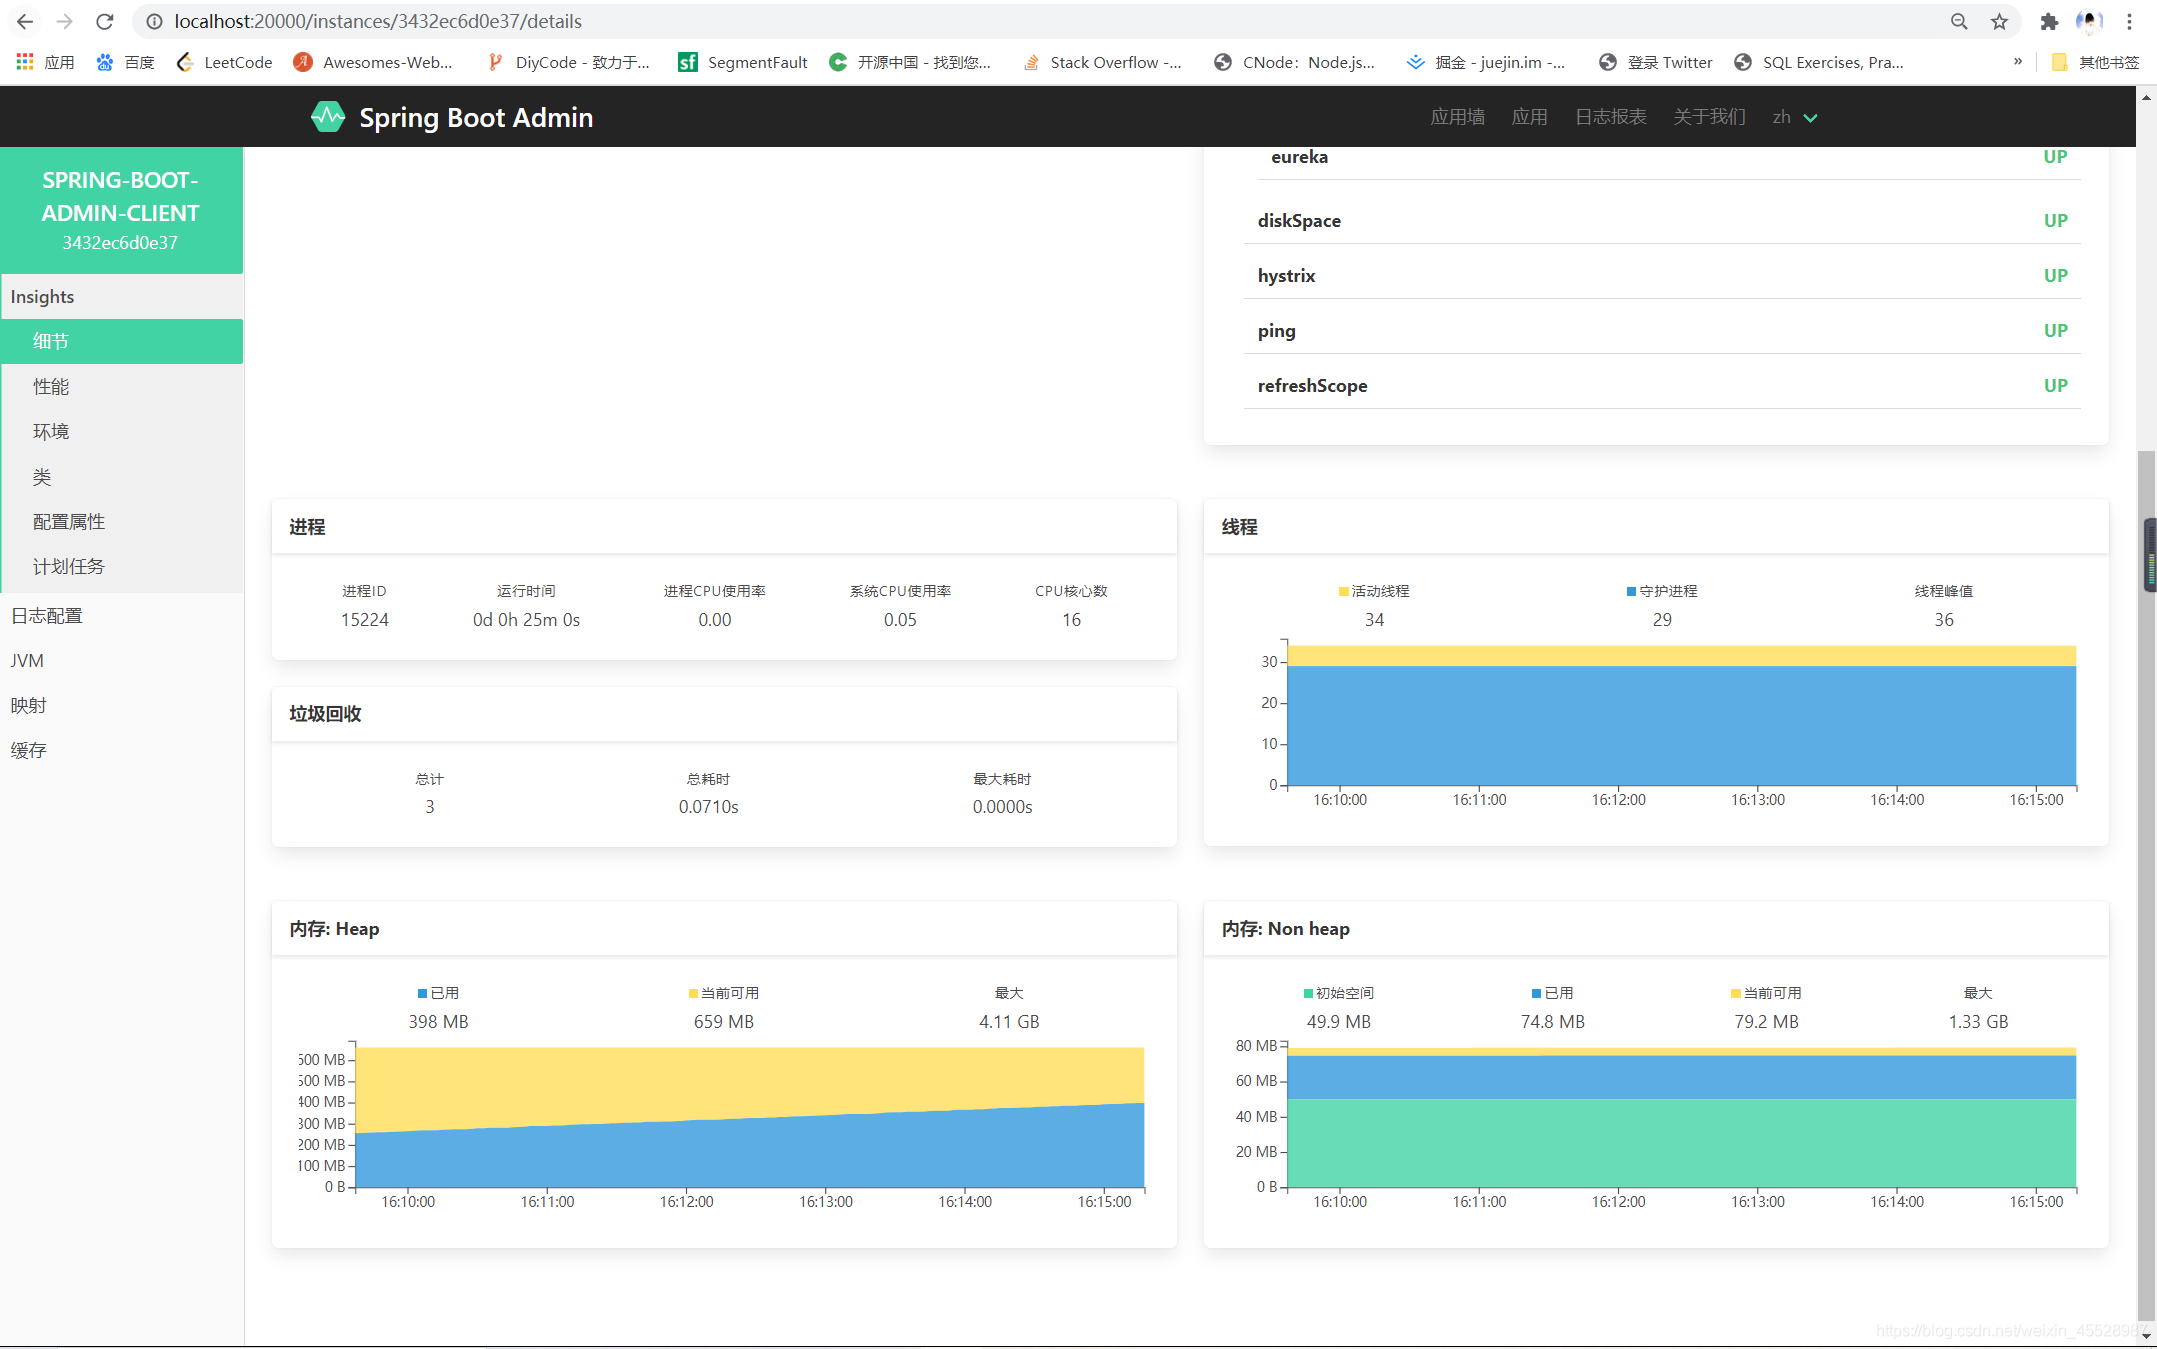
通过Actuator查看spring boot 应用运行的过程中的各项指标,通过图形化界面呈现出来。有点类似于JDK自带的工具jvisualvm,
但是它拥有更加强大丰富的功能。
1.查看JVM、tomcat进程信息。
2.查看应用配置信息,系统属性、系统环境变量等。
3.查看创建的bean信息。
4.查看应用中的运行日志。
5.查看web应用的访问端点。
6.查看http跟踪信息。
依赖
springboot admin client 模块
<!--spring boot admin client-->
<dependency>
<groupId>de.codecentric</groupId>
<artifactId>spring-boot-admin-starter-client</artifactId>
<version>2.2.2</version>
</dependency>
springboot admin server 模块
<!--spring boot admin server-->
<dependency>
<groupId>de.codecentric</groupId>
<artifactId>spring-boot-admin-starter-server</artifactId>
<version>2.2.2</version>
</dependency>
配置文件
client配置文件
spring:
application:
name: spring-boot-admin-client
# boot:
# admin:
# client:
# url: http://localhost:20000 #注册到 admin server的 url 如果注册到了注册中心就不需要在此配置了,会给adminserver多出重复的应用信息。
management:
endpoints:
web:
exposure:
include: '*' # 暴露所有端点
endpoint:
health:
show-components: always # 端点监控检查
#logging:
# file: spring-boot-admin-client.log #日志监控文件
eureka:
client:
service-url:
defaultZone: http://root:root@localhost:10000/eureka/
register-with-eureka: true
fetch-registry: true
server:
port: 30000
server配置文件
server:
port: 20000
spring:
application:
name: spring-boot-admin-server
eureka:
client:
fetch-registry: true
register-with-eureka: false
service-url:
defaultZone: http://root:root@localhost:10000/eureka/
访问admin server