
Python Automated Machine Learning tool :TPOT
TPOT是一个开源的机器学习项目,项目地址为:https://github.com/EpistasisLab/tpot
1. TPOT with code
step 1: 导入类模块

from tpot import TPOTClassifier    #分类器
from tpot import TPOTRegressor     #回归器
step 2: 实例化(default)
#创建默认分类器
default_pipeline_optimizer_classifier = TPOTClassifier()
#创建默认回归器
default_pipeline_optimizer_regressor  = TPOTRegressor()
step 2: 实例化(custom)
#创建自定义分类器
custom_pipeline_optimezer_classifier = TPOTClassifier(generations=50,population_size=50,cv=5,random_state=100,
                                                      verbosity=2)
#创建自定义回归器
custom_pipeline_optimezer_regressor  =TPOTRegressor(generations=5,population_size=5,cv=5,random_state=20,
                                                      verbosity=1)
step 3: 准备训练集、测试集
X_train, y_train, X_test, y_test = ?
#可以使用sklearn.model_selection.train_test_split()函数

step 4: 训练
custom_pipeline_optimezer_regressor.fit(X_train, y_train)

step 5: 测试
print(custom_pipeline_optimezer_regressor.score(X_test, y_test))

step 6: export the corresponding Python code for the optimized pipeline
custom_pipeline_optimezer_regressor.export('tpot_exported_pipeline.py')
2.scoring function
方式一:pass a string to the attribute scoring
属性值可以为
'accuracy', 'adjusted_rand_score', 'average_precision', 'balanced_accuracy',
'f1','f1_macro', 'f1_micro', 'f1_samples', 'f1_weighted', 'neg_log_loss', 'neg_mean_absolute_error',
'neg_mean_squared_error', 'neg_median_absolute_error', 'precision', 'precision_macro', 'precision_micro',
'precision_samples', 'precision_weighted','r2', 'recall', 'recall_macro', 'recall_micro', 'recall_samples',
'recall_weighted', 'roc_auc', 'my_module.scorer_name*'
方式二:用户自定义
# Make a custom metric function
def my_scoring_func(y_true, y_pred):
    return mean_squared_error(y_true, y_pred)

# Make a custom a scorer from the custom metric function
# Note: greater_is_better=False in make_scorer below would mean that the scoring function should be minimized.
my_scorer = sklearn.metrics.scorer.make_scorer(my_scoring_func,greater_is_better=False)
custom_pipeline_optimezer_regressor  =TPOTRegressor(generations=5,population_size=5,cv=5,random_state=20,
                                                      verbosity=1,scoring=my_scorer)
3.config_dict
有四个默认的configuration options
- Default TPOT
- TPOT light
- TPOT MDR
- TPOT sparse
具体说明:http://epistasislab.github.io/tpot/using/#built-in-tpot-configurations
custom_pipeline_optimezer_regressor  =TPOTRegressor(generations=5,population_size=5,cv=5,random_state=20,
                                                      verbosity=1,config_dict='TPOT light')
4.用户自定义config
tpot_config = {
    'sklearn.naive_bayes.GaussianNB': {
    },

    'sklearn.naive_bayes.BernoulliNB': {
        'alpha': [1e-3, 1e-2, 1e-1, 1., 10., 100.],
        'fit_prior': [True, False]
    },

    'sklearn.naive_bayes.MultinomialNB': {
        'alpha': [1e-3, 1e-2, 1e-1, 1., 10., 100.],
        'fit_prior': [True, False]
    }
}
custom_pipeline_optimezer_regressor  =TPOTRegressor(generations=5,population_size=5,cv=5,random_state=20,
                                                      verbosity=1,config_dict=tpot_config)
5.分布式环境训练
from sklearn.externals import joblib
import distributed.joblib
from dask.distributed import Client

# connect to the cluster
client = Client('schedueler-address')

# create the estimator normally
estimator = TPOTClassifier(n_jobs=-1)

# perform the fit in this context manager
with joblib.parallel_backend("dask"):
    estimator.fit(X, y)
6.实际项目(回归问题)
项目目标是预测下游水库的进水量,其源数据内容如下,共有2161条记录
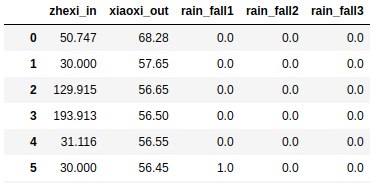
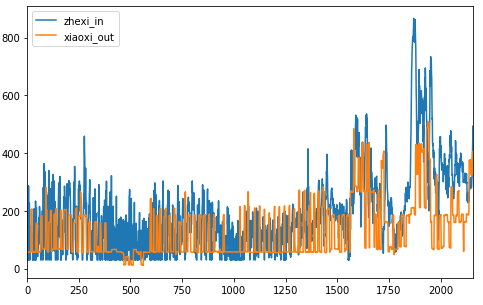
第一列是下游水库的进水量,第二列是上游水库的出水量,其余的是上下游之间降雨观测点的雨量信息 . 现只考虑上下游进出水量之间的影响,预测下游水库的进水量。
两者的趋势如下图
完整代码
from tpot import TPOTClassifier
from tpot import TPOTRegressor
from sklearn.model_selection import train_test_split
from sklearn.metrics import mean_squared_error
from sklearn.metrics.scorer import make_scorer
from sklearn.externals import joblib
from sklearn.ensemble import RandomForestRegressor
from sklearn.grid_search import GridSearchCV
#import distributed.joblib
from dask.distributed import Client
from dask.distributed import LocalCluster
import numpy as np
import matplotlib.pyplot as plt
import pandas as pd

def get_train_test_by_OP(data,offset,period):
		xiaoxi_out = data[:,1]
		zhexi_in = data[:,0]
		size = len(zhexi_in)

		source_xiaoxi_out=[[] for i in range(period)]
		source_zhexi_in = [[] for i in range(period)]
		for i in range(period):
			source_xiaoxi_out[i]=xiaoxi_out[i :size-offset-period+i]
			source_zhexi_in[i] = zhexi_in[i+offset:size-period+i]
		data_vec = np.hstack((np.array(source_xiaoxi_out).transpose(1,0),
		                     np.array(source_zhexi_in).transpose(1,0)))
		label = zhexi_in[offset+period:]
		X, _X, y ,  _y = train_test_split(data_vec,label,test_size=0.1,random_state=13)
		return X, y , _X, _y

def my_scoring_func(y_true,y_pred):
    return (sum((y_true - y_pred)**2)/len(y_true))

custom_pipeline_optimezer_regressor  =TPOTRegressor(generations=5,population_size=5,cv=5,random_state=20,
                                                      verbosity=2,scoring=my_scorer)

data = np.array(pd.read_csv('seasons/2015_spring.csv',header=None))
X, y ,_X, _y = get_train_test_by_OP(data,54,44)

custom_pipeline_optimezer_regressor.fit(X, y)

print(custom_pipeline_optimezer_regressor.score(_X, _y))
custom_pipeline_optimezer_regressor.export('tpot_exported_pipeline.py')
结果如下
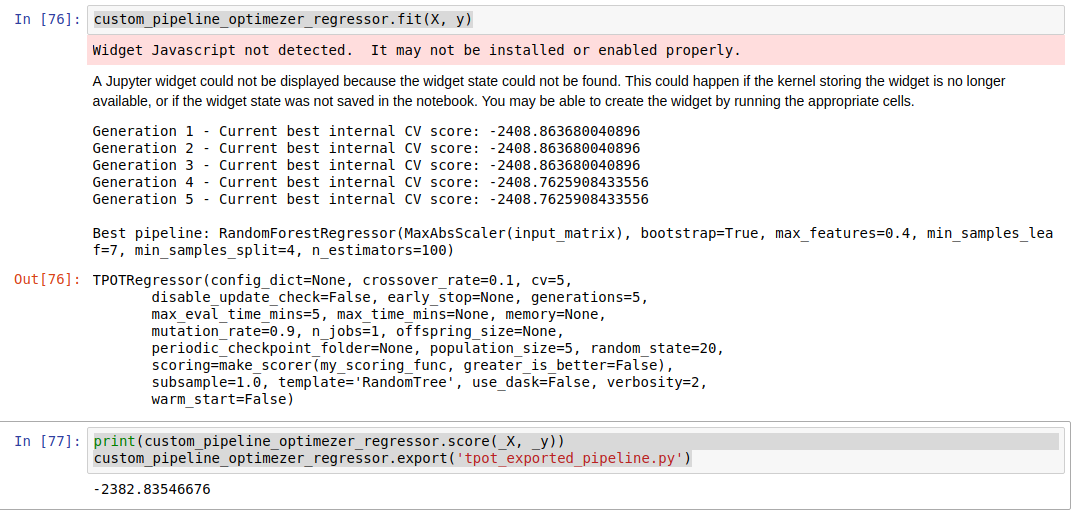
训练完成后,TPOT已经给出了最佳模型及其参数信息,我们可以这些信息建模预测,分析结果
model = RandomForestRegressor(bootstrap=True, max_features=0.4,
                              min_samples_leaf=7, min_samples_split=4, n_estimators=100)
model.fit(X,y)
pre = model.predict(_X)
mse = mean_squared_error(_y, pre)
plt.figure(figsize=(8,5))
plt.plot(_y)
plt.plot(pre)
plt.legend(('true','predict'))
plt.title('mse:'+str(mse))
plt.show()
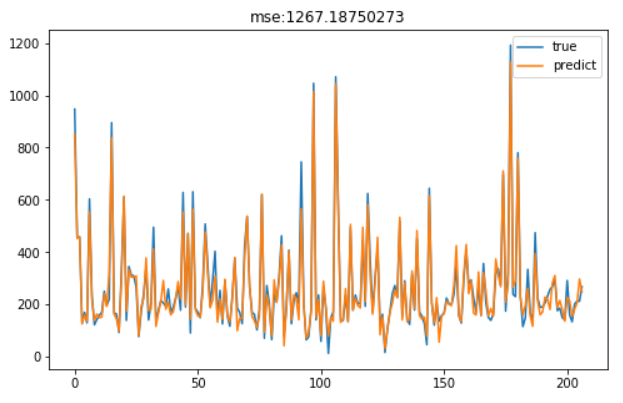
可见,效果不错。当然我们也可以用grid_searh来调参
tuned_parameters = [{'max_features':[i/10 for i in range(1,10)],
                     'min_samples_leaf':[i for i in range(1,10)],
                     'bootstrap':[True,False],
                     'min_samples_split':[i for i in range(2,10)],
                     'n_estimators':[i for i in range(80,150)],
                     'max_features':[i/10 for i in range(1,10)]}]
clf = GridSearchCV(RandomForestRegressor(),tuned_parameters)

clf.fit(X,y)
pre = model.predict(_X)
print(mean_squared_error(_y, pre))
print(clf.best_estimator_)
上面我们用到的是2015年春季的数据训练的模型,我们希望该模型能准确预测春季下游水库的进水量。为此,利用该模型预测2018年春季的下游水库进水量,看其是否达到一个很好的效果。结果如下
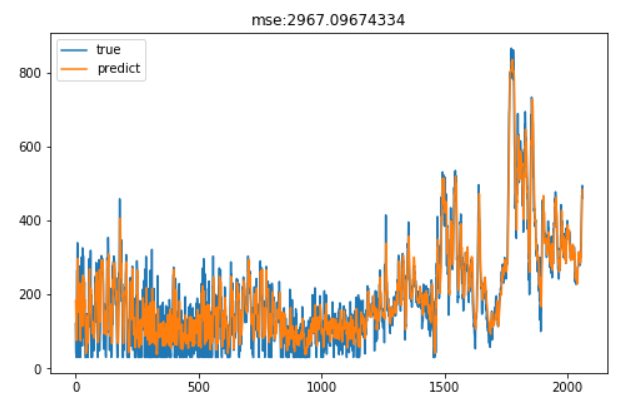
可以看到,预测效果较好。
7.mnist手写数字识别(分类问题)
from tpot import TPOTClassifier
from sklearn.datasets import load_digits
from sklearn.model_selection import train_test_split

digits = load_digits()
X_train, X_test, y_train, y_test = train_test_split(digits.data, digits.target,
                                                    train_size=0.75, test_size=0.25)

pipeline_optimizer = TPOTClassifier(generations=5, population_size=50, cv=5,
                                    random_state=42, verbosity=2,n_jobs=6)
pipeline_optimizer.fit(X_train, y_train)
print(pipeline_optimizer.score(X_test, y_test))
pipeline_optimizer.export('tpot_exported_pipeline_classifier.py')
结果如下
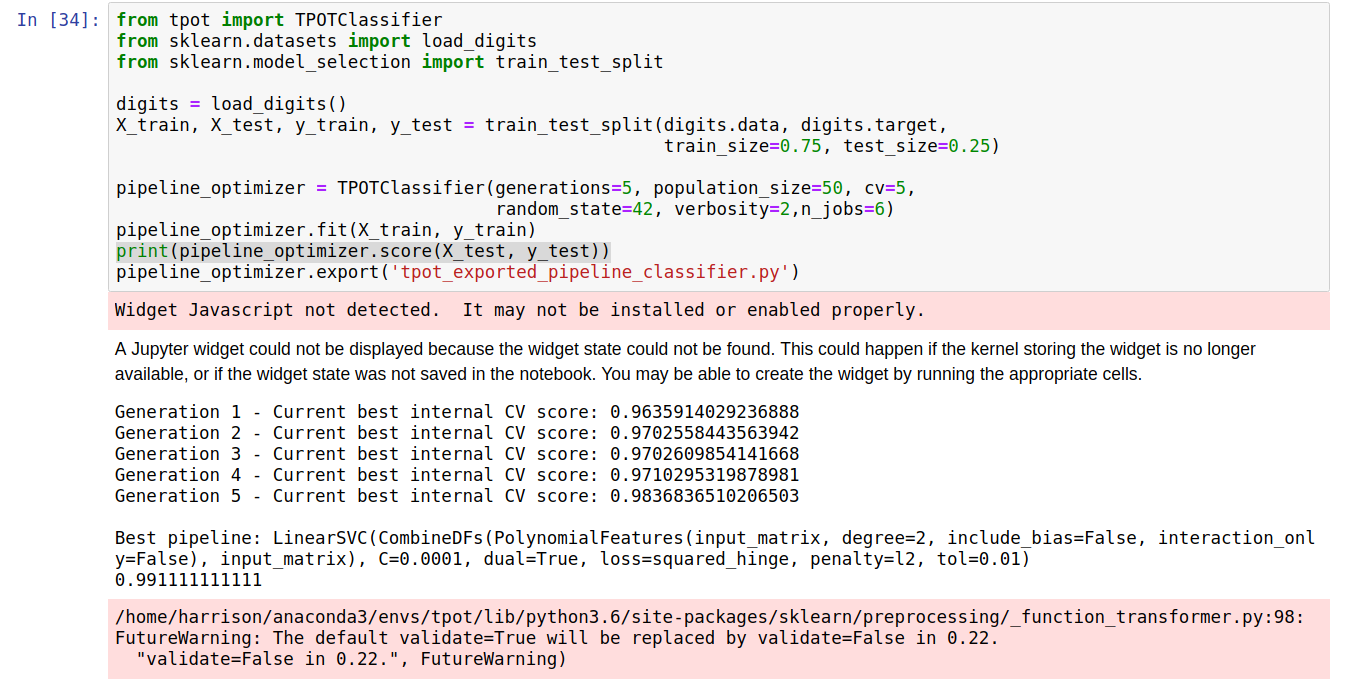
最终的准确度达到了0.991111111111,由于笔者电脑硬件限制,跑起来有些吃力,大家可尝试将generations, population_size的值增大,观察跑的结果
8. 总结
由两次实验的结果可见,无论是回归问题还是分类问题,TPOT都可以为我们寻找一个比较优秀的解决方案,但是整个训练过程比较费时,对硬件资源要求较高。总的说来,这是一个非常优秀的机器学习工具。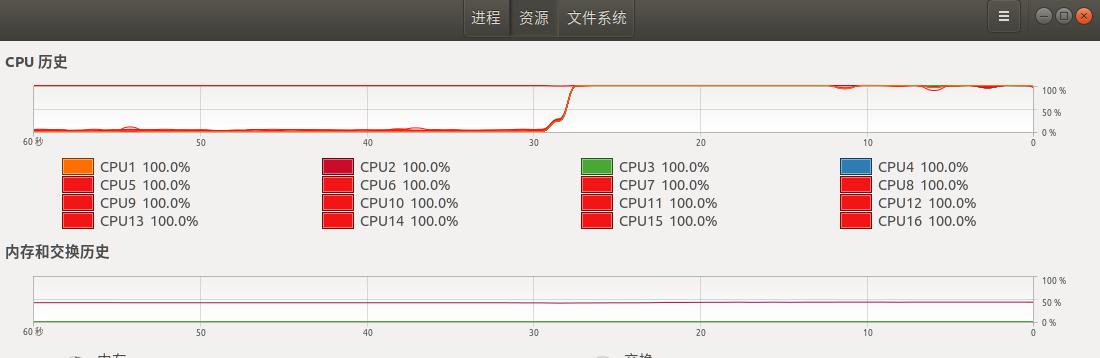

 浙公网安备 33010602011771号