Go服务监控
使用Golang可以开发出高性能的HTTP、GRPC服务。一般项目运行后,我们也需要监控服务的性能或者进行调试。除了打日志,还有没有其他可视化的方案呢?答案是有的。
本文将会介绍几种常用的监控方案。
pprof
这个是go语言自带的。启用很简单:
_ "net/http/pprof"
仅需显式的在 main 包的 import 里增加上面一行即可。完整使用示例:
package main

import (
	"net/http"
	_ "net/http/pprof"
)

func main(){
    //提供给负载均衡探活以及pprof调试
	http.HandleFunc("/", func(w http.ResponseWriter, r *http.Request) {
		w.Write([]byte("ok"))
	})

	http.ListenAndServe(":10108", nil)
}
运行之后,在浏览器打开 http://127.0.0.1:10108/debug/pprof/就能看到监控的一些信息了:
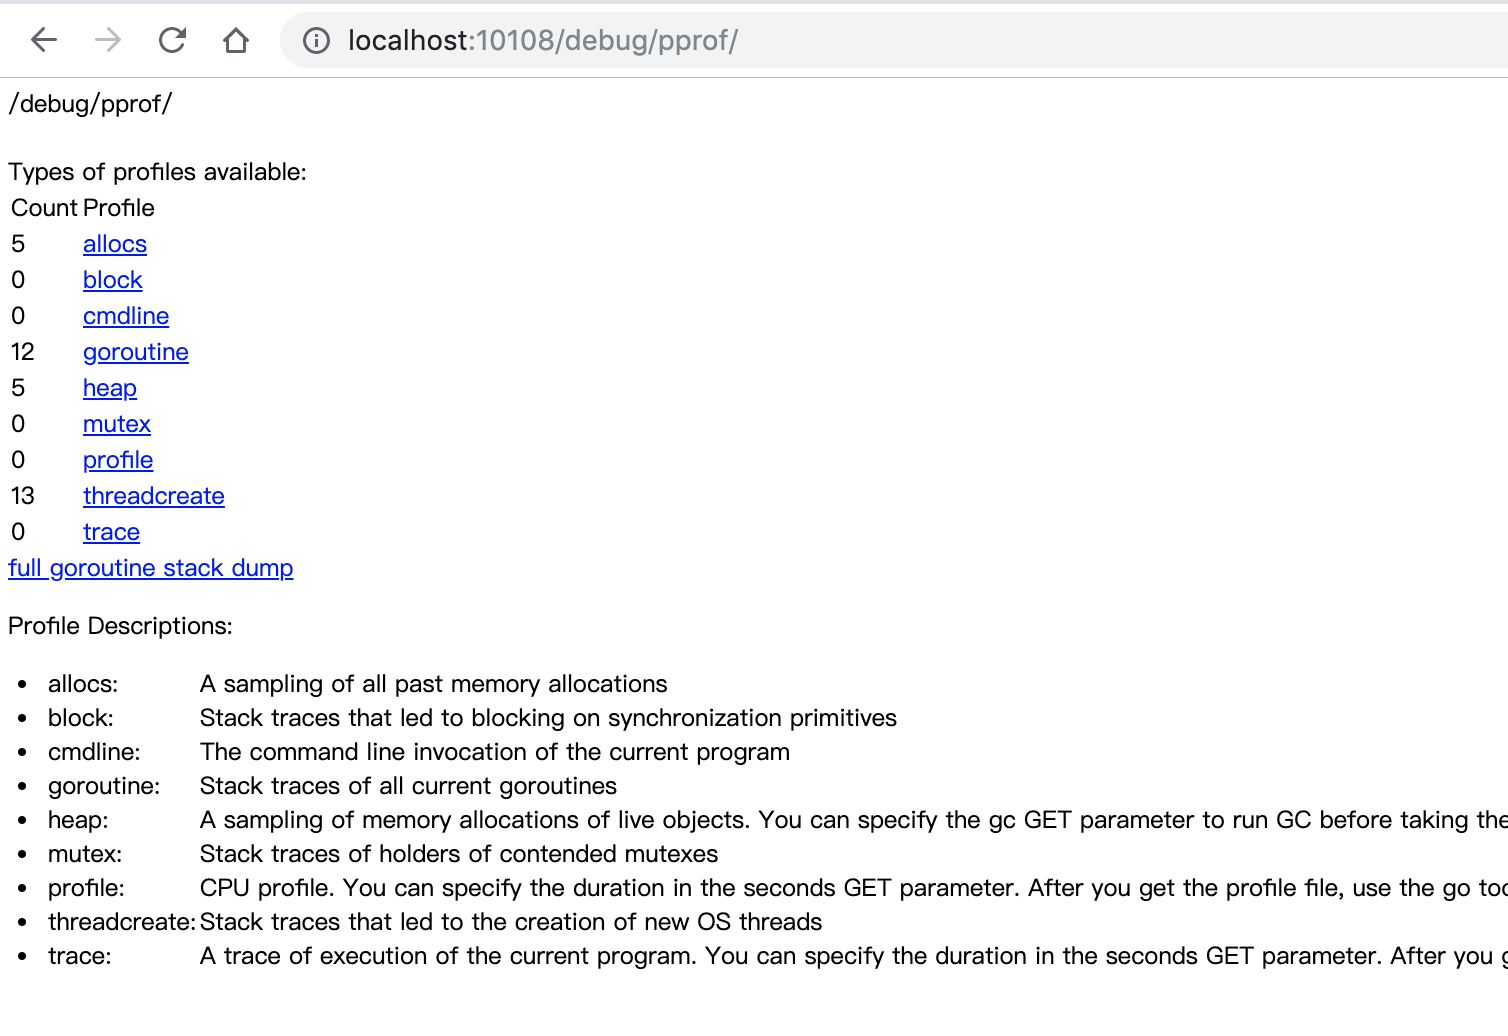
注:生产环境一般不会按上面那么写,都是开个协程:
go http.ListenAndServe(":10108", nil)
如何启动 PProf 可视化界面?
需要
graphviz支持,可以到 http://www.graphviz.org/download/ 下载,并把bin加入到环境变量。Mac可以使用brew安装。
下面以heap为例:
方法一:
go tool pprof -http=:8081 http://localhost:10108/debug/pprof/heap
方法二:
go tool pprof http://localhost:10108/debug/pprof/heap
然后在交互式命令行输入web即可跳转到默认浏览器:
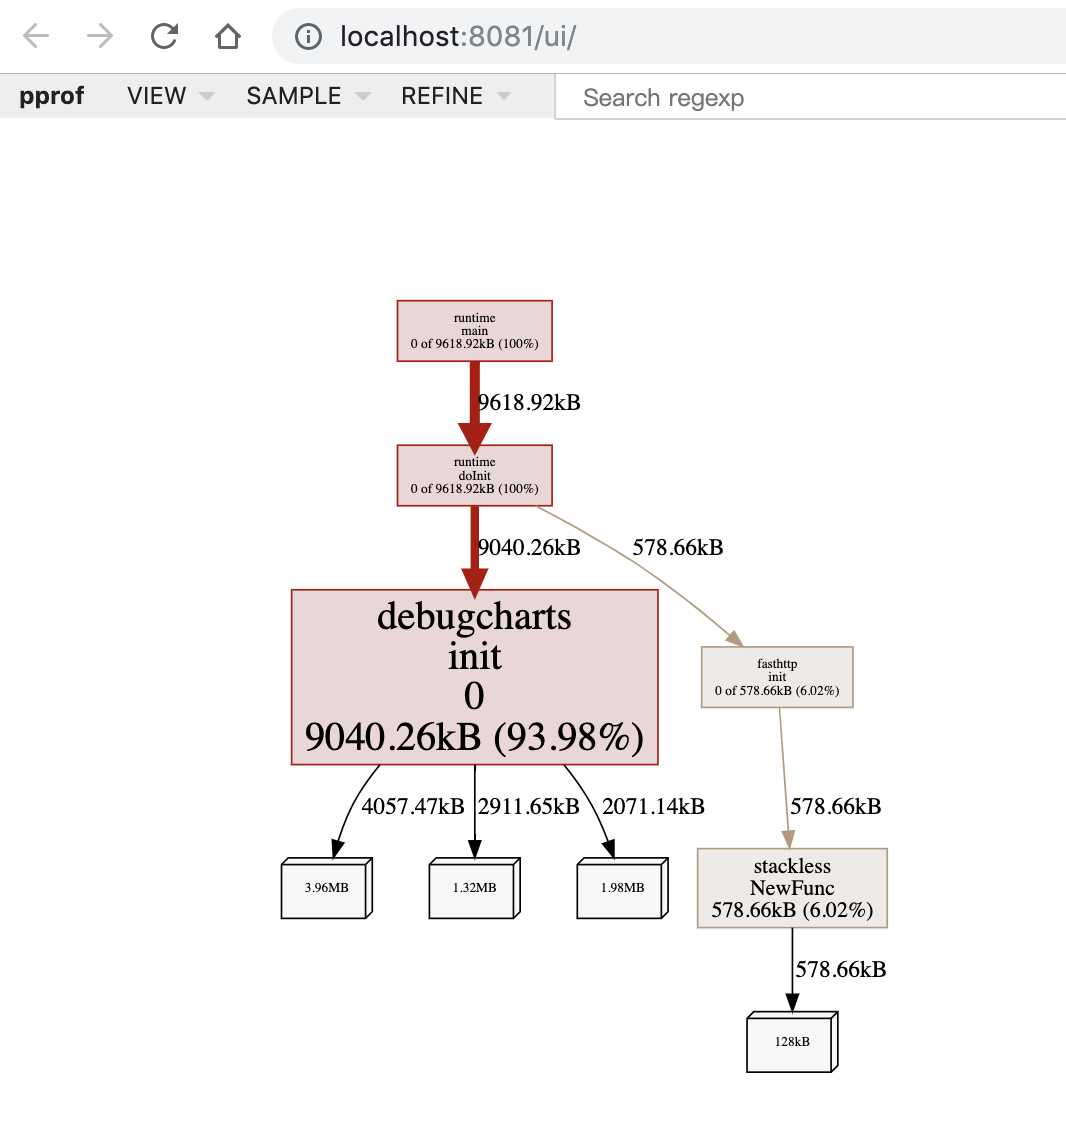
查看协程信息:
go tool pprof -http=:8081 http://localhost:10108/debug/pprof/goroutine
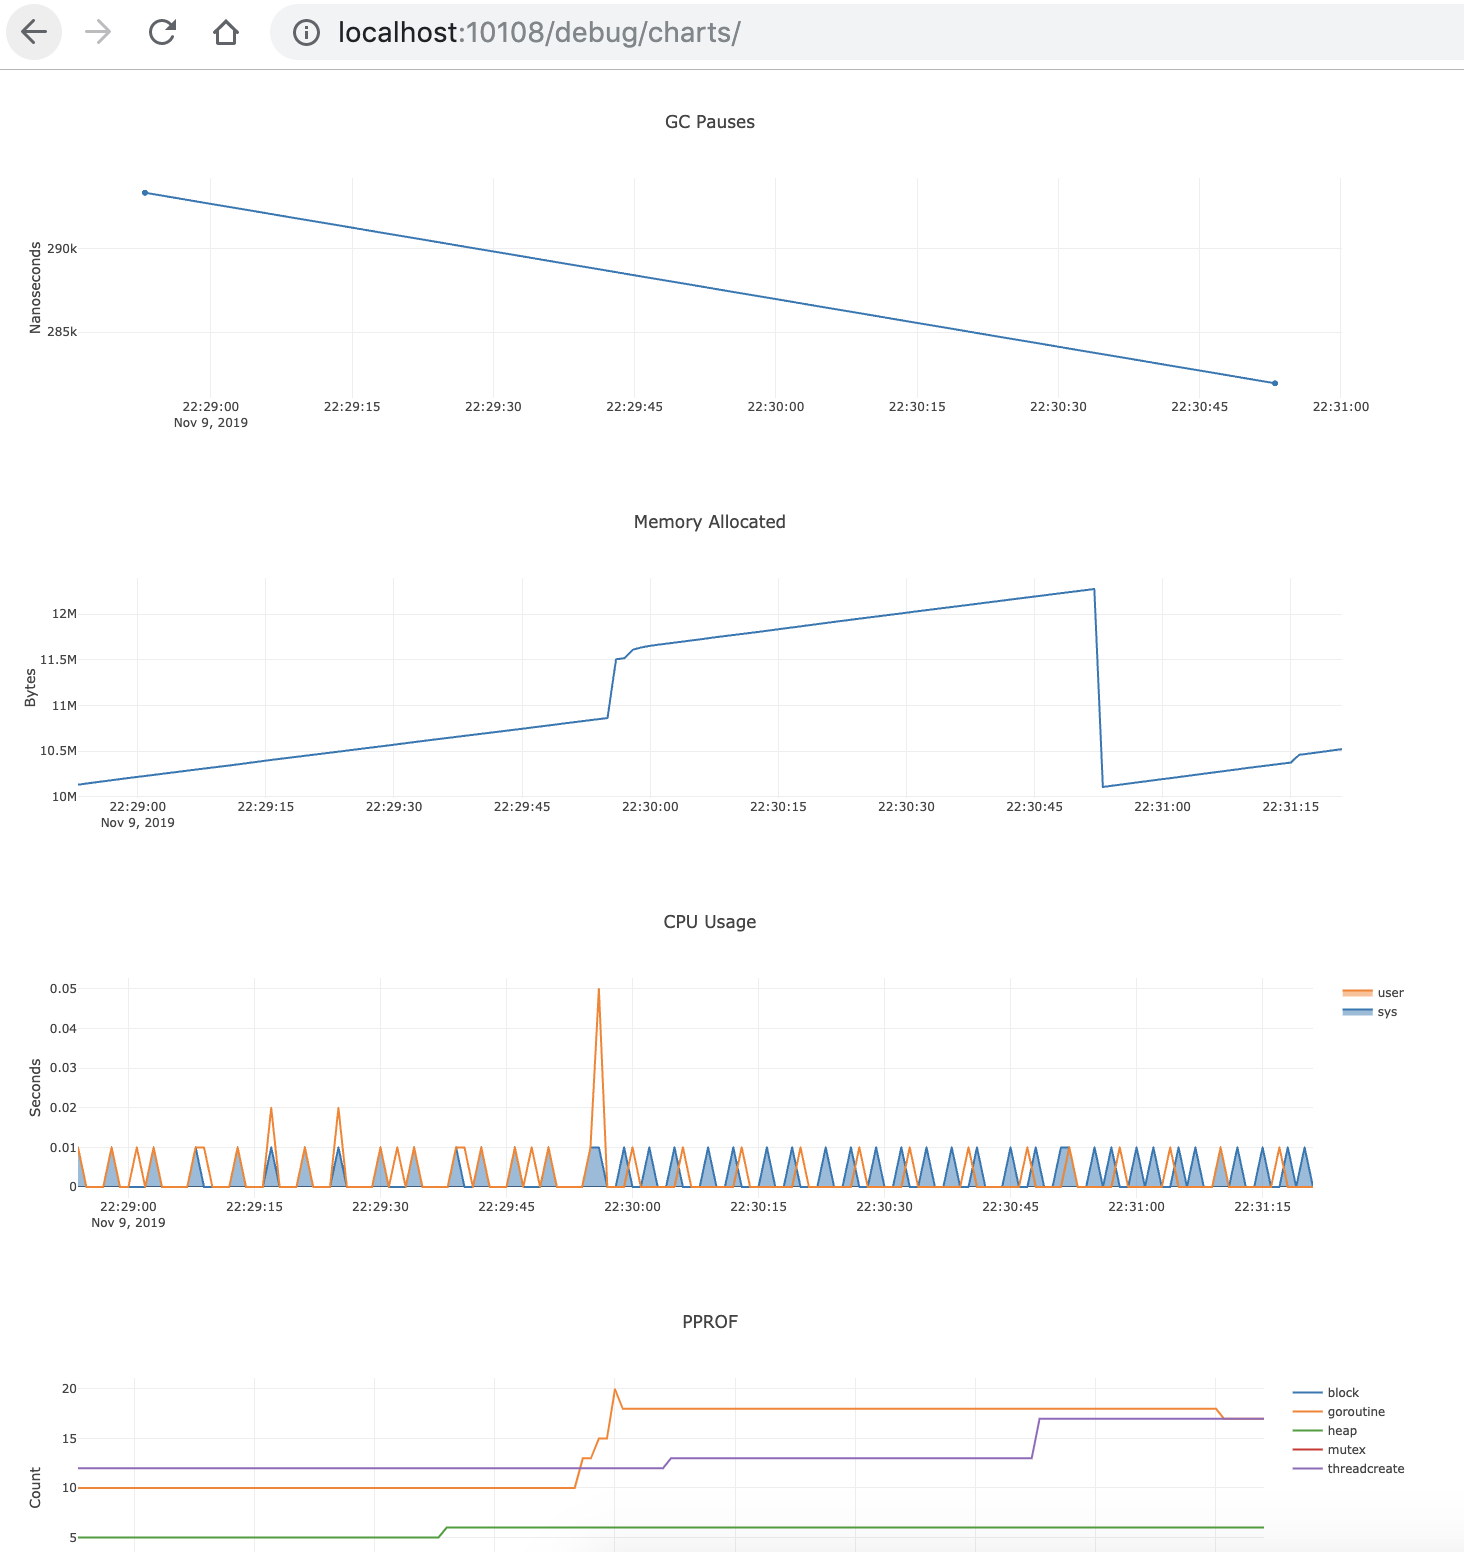
debugcharts
一个可以实时查看golang程序内存、CPU、GC、协程等变化情况的可视化工具。
debugcharts 监控占用内存大,生产环境不建议开启。
跟pprof一样, import引入, 然后开端口监听就行了:
_ "github.com/mkevac/debugcharts"
//省略其它代码...
http.ListenAndServe(":10108", nil)
运行后,浏览器打开 http://localhost:10108/debug/charts/ 就能看到了:
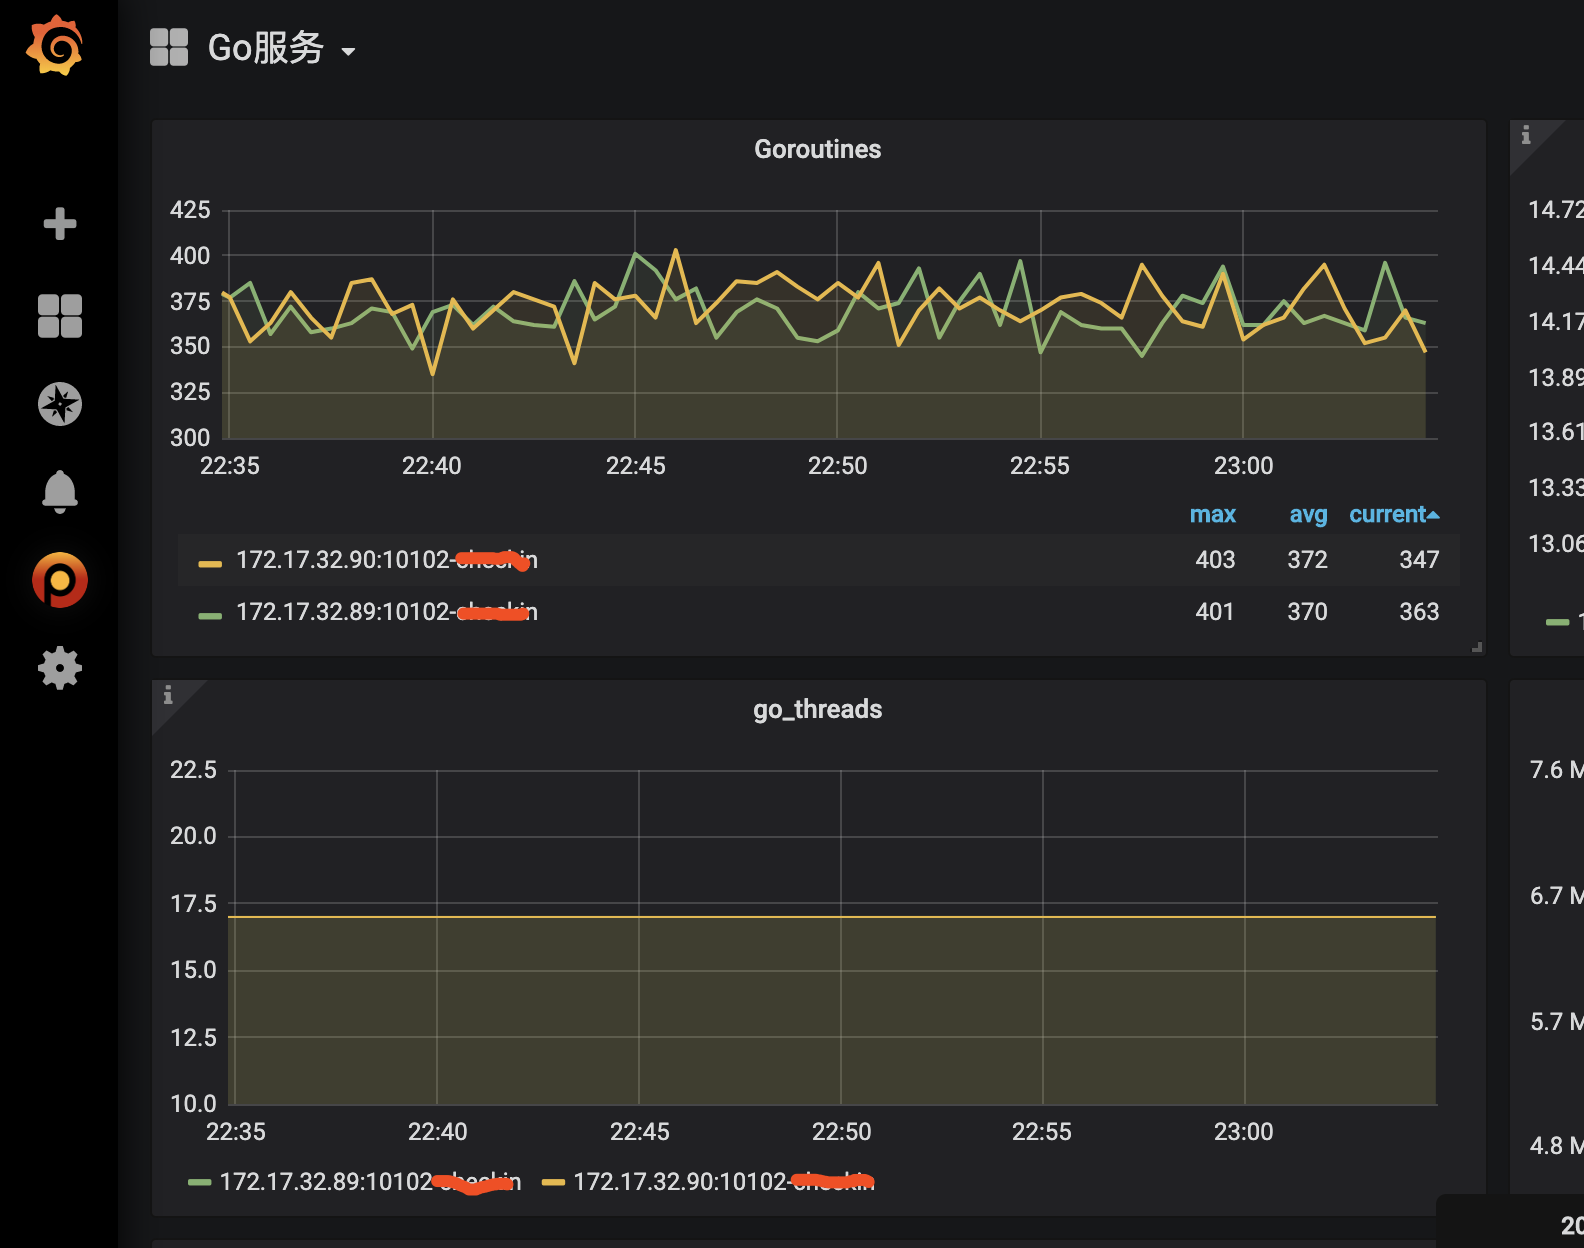
prometheus
prometheus是grafana的插件,支持go监控的可视化。
首先需要代码里引入包:
"github.com/prometheus/client_golang/prometheus/promhttp"
然后增加路由:
//prometheus
http.Handle("/metrics", promhttp.Handler())
http.ListenAndServe(":10108", nil)
配置grafana后,效果图:
一个端口开启 pprof+charts+prometheus
如果每一个监控都开一个端口就有点浪费端口了。可以在一个端口里开启 pprof+charts+prometheus 。
1、入口文件增加代码:
//监控
go func() {
   //提供给负载均衡探活
   http.HandleFunc("/", func(w http.ResponseWriter, r *http.Request) {
      w.Write([]byte("ok"))

   })

   //prometheus
   http.Handle("/metrics", promhttp.Handler())

   //pprof, go tool pprof -http=:8081 http://$host:$port/debug/pprof/heap
   http.ListenAndServe(":10108", nil)
}()
2、import增加
_ "github.com/mkevac/debugcharts"
"github.com/prometheus/client_golang/prometheus/promhttp"
"net/http"
_ "net/http/pprof"
参考
1、Golang pprof详解
https://studygolang.com/articles/14519
2、mkevac/debugcharts: Very simple charts with some debug data for Go programs
https://github.com/mkevac/debugcharts
3、prometheus/client_golang: Prometheus instrumentation library for Go applications
https://github.com/prometheus/client_golang/
欢迎关注公众号"飞鸿影记(fhyblog)",探寻物件背后的逻辑,记录生活真实的影子。

作者:飞鸿影
出处:http://52fhy.cnblogs.com/
版权申明:没有标明转载或特殊申明均为作者原创。本文采用以下协议进行授权,自由转载 - 非商用 - 非衍生 - 保持署名 | Creative Commons BY-NC-ND 3.0,转载请注明作者及出处。


 浙公网安备 33010602011771号