vue中使用v-chart时放大缩小屏幕,echarts图自适应

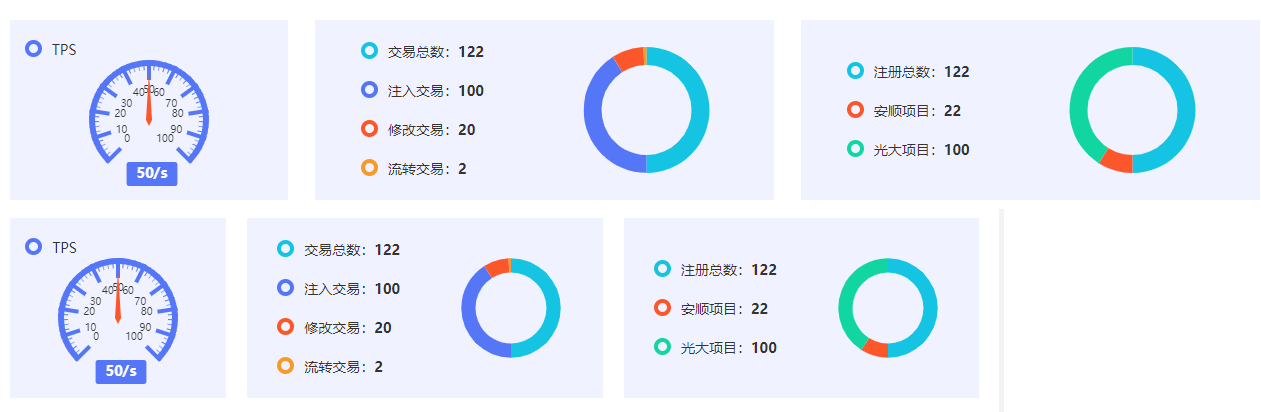
 如上图所示,在放大/缩小浏览器屏幕时,echarts图可以自适应。


实现代码:

1.html:

                <div class="tps">
                    <p>TPS</p>
                    <div class="tps_charts">
                        <v-chart  ref="runTimes_creditChart" class="credit-chart" :style="{width:'100%',height: '160px',}" :options="tps_options"></v-chart>
                    </div>
                </div>
                <div class="transactions">
                    <div class="transactions_field">
                        <p>交易总数:<span>122</span></p>
                        <p>注入交易:<span>100</span></p>
                        <p>修改交易:<span>20</span></p>
                        <p>流转交易:<span>2</span></p>
                    </div>
                    <div class="transactions_charts">
                        <v-chart ref="transactions_creditChart" class="credit-chart" :style="{width:'100%',height: '180px'}" :options="transactions_options"></v-chart>
                    </div>
                </div>
                <div class="registers">
                    <div class="registers_field">
                        <p>注册总数:<span>122</span></p>
                        <p>安顺项目:<span>22</span></p>
                        <p>光大项目:<span>100</span></p>
                    </div>
                    <div class="registers_charts">
                        <v-chart ref="registers_creditChart" class="credit-chart" :style="{width:'100%',height: '180px',}" :options="registers_options"></v-chart>
                    </div>
                </div> 

使用了v-chart来插入echarts图,在页面中有三个echarts图,均要自适应。

    mounted(){
        window.addEventListener("resize", this.resizeTheChart);
    },
    beforeDestroy() {
        window.removeEventListener("resize", this.resizeTheChart);
    },
    methods: {
        resizeTheChart() {
            if (this.$refs.runTimes_creditChart) {
                this.$refs.runTimes_creditChart.resize();
            }
            if (this.$refs.transactions_creditChart) {
                this.$refs.transactions_creditChart.resize();
            }
            if (this.$refs.registers_creditChart) {
                this.$refs.registers_creditChart.resize();
            }
        },
    }

2.options:

            tps_options : {
                tooltip : {
                    formatter: "{a} <br/>{b} : {c}%"
                },
                series: [
                    {
                        name: '业务指标',
                        type: 'gauge',
                        // center: ['50%', '45%'],
                        detail: {
                            textStyle: { // 其余属性默认使用全局文本样式,详见TEXTSTYLE
                                fontWeight: 'bolder',
                                fontSize: 14,
                                color: '#ffffff'
                            },
                            borderRadius: 3,
                            backgroundColor: '#5576f6',
                            // width: 100,
                            offsetCenter: ['5%', '90%'], // x, y,单位px
                            formatter:'{value}/s'
                        },
                        data: [
                            {
                                value: 50,
                            }
                        ],
                        itemStyle:{//指针样式
                            color: '#fc572b',
                        },
                        pointer: {
                            width:3,//指针的宽度
                            length:"80%", //指针长度,按照半圆半径的百分比
                            shadowColor : '#ccc', //默认透明
                            shadowBlur: 5
                        },
                        axisLabel: {
                            show: true,
                                textStyle: {
                                color: '#333333',  //更改坐标轴文字颜色
                                fontSize : 10   //更改坐标轴文字大小
                            }
                        },
                        axisLine: {            // 坐标轴线
                            lineStyle: {       // 属性lineStyle控制线条样式
                                width: 6,
                                color:  [[0.2, '#5576f6'], [0.8, '#5576f6'], [1, '#5576f6']]
                            },
                        },
                        axisTick: {            // 坐标轴小标记
                            length:10,        // 属性length控制线长
                            lineStyle: {       // 属性lineStyle控制线条样式
                                color: 'auto',
                            }
                        },
                        splitLine: {           // 分隔线
                            length:20,         // 属性length控制线长
                            lineStyle: {       // 属性lineStyle(详见lineStyle)控制线条样式
                                color: 'auto',
                                width: 4,
                            }
                        },
                    }
                ]
            },
            transactions_options: {
                tooltip: {
                    trigger: 'item',
                },
                series: [
                    {
                        type:'pie',
                        radius: ['50%', '70%'],
                        // center: ['60%', '65%'],
                        avoidLabelOverlap: false,
                        label: {
                            normal: {
                                show: false,
                                position: 'center'
                            },
                            emphasis: {
                                show: true,
                                textStyle: {
                                    fontSize: '14',
                                    fontWeight: 'bold'
                                }
                            }
                        },
                        labelLine: {
                            normal: {
                                show: false
                            }
                        },
                        data:[
                            {
                                value:122,
                                name: '交易总数',
                                itemStyle: { color: '#15c4e3' }
                            },
                            {
                                value:100,
                                name: '注入交易',
                                itemStyle: { color: '#5576f6' }
                            },
                            {
                                value:20,
                                name: '修改交易',
                                itemStyle: { color: '#fc572b' }
                            },
                            {
                                value:2,
                                name: '流转交易',
                                itemStyle: { color: '#f99928' }
                            },
                        ]
                    }
                ]
            },
            registers_options: {
                tooltip: {
                    trigger: 'item',
                },
                series: [
                    {
                        type:'pie',
                        radius: ['50%', '70%'],
                        // center: ['60%', '65%'],
                        avoidLabelOverlap: false,
                        label: {
                            normal: {
                                show: false,
                                position: 'center'
                            },
                            emphasis: {
                                show: true,
                                textStyle: {
                                    fontSize: '14',
                                    fontWeight: 'bold'
                                }
                            }
                        },
                        labelLine: {
                            normal: {
                                show: false
                            }
                        },
                        data:[
                            {
                                value:122,
                                name: '注册总数',
                                itemStyle: { color: '#15c4e3' }
                            },
                            {
                                value:22,
                                name: '安顺项目',
                                itemStyle: { color: '#fc572b' }
                            },
                            {
                                value:100,
                                name: '光大项目',
                                itemStyle: { color: '#12d6a1' }
                            },
                        ]
                    }
                ]
            },

此时,基本上就可以了,


注意:

1.需要在main.js中引入:

import ECharts from 'vue-echarts/components/ECharts'
import 'echarts/lib/chart/bar'
import 'echarts/lib/component/tooltip'

Vue.component('v-chart', ECharts)

安装依赖:

npm install vue-echarts

2.需要对三个v-echart的ref="runTimes_creditChart" 设置不同的值,然后在方法中对对应的进行处理,若是设置为同一个值,在方法中只进行一次设置,则只有最后一个会自适应,其他的不会。


ok,就这些就可以了。

posted @ 2019-09-24 20:05  苏小落  阅读(12850)  评论(1编辑  收藏  举报