【Python机器学习实战】决策树和集成学习(二)——决策树的实现
摘要:上一节对决策树的基本原理进行了梳理,本节主要根据其原理做一个逻辑的实现,然后调用sklearn的包实现决策树分类。
这里主要是对分类树的决策进行实现,算法采用ID3,即以信息增益作为划分标准进行。
首先计算数据集的信息熵,代码如下:
 1 import math
 2 import numpy as np
 3
 4
 5 def calcShannonEnt(data):
 6     num = len(data)
 7     # 保存每个类别的数目
 8     labelCounts = {}
 9     # 每一个样本
10     for featVec in data:
11         currentLabel = featVec[-1]
12         if currentLabel not in labelCounts.keys():
13             labelCounts[currentLabel] = 0
14         labelCounts[currentLabel] += 1
15     # 计算信息增益
16     shannonEnt = 0
17     for key in labelCounts.keys():
18         prob = float(labelCounts[key] / num)
19         shannonEnt -= prob * math.log(prob)
20     return shannonEnt
然后是依据某个特征的特征值将数据划分开的函数:
def splitData(dataSet, axis, value):
    """
    axis为某一特征维度
    value为划分该维度的值
    """
    retDataSet = []
    for featVec in dataSet:
        if featVec[axis] == value:
            # 舍弃掉这一维度上对应的值,剩余部分作为新的数据集
            reducedFeatVec = featVec[:axis]
            reducedFeatVec.extend(featVec[axis+1:])
            retDataSet.append(reducedFeatVec)
    return retDataSet
这个函数是依据选取的某个维度的某个值,分割后的数据,比如:
>>data
Out[1]: [[1, 1, 'yes'], [1, 1, 'yes'], [1, 0, 'no'], [0, 1, 'no'], [0, 1, 'no']]
>>splitData(data, 0, 1)
Out[2]: [[1, 'yes'], [1, 'yes'], [0, 'no']]
>>splitData(data, 0, 0)
Out[3]: [[1, 'no'], [1, 'no']]
接下来就是从数据中选取信息增益最大的特征了,输入是数据集,返回信息增益最大的特征的index,代码如下:
# 选择最好的特征进行数据划分
# 输入dataSet为二维List
def chooseBestFeatuerToSplit(dataSet):
    # 计算样本所包含的特征数目
    numFeatures = len(dataSet[0]) - 1
    # 信息熵H(Y)
    baseEntropy = calcShannonEnt(dataSet)
    # 初始化
    bestInfoGain = 0; bestFeature = -1
    # 遍历每个特征,计算信息增益
    for i in range(numFeatures):
        # 取出对应特征值,即一列数据
        featList = [example[i] for example in dataSet]
        uniqueVals = np.unique(featList)
        newEntropy = 0
        for value in uniqueVals:
            subDataSet = splitData(dataSet, i, value)
            prob = len(subDataSet)/float(dataSet)
            newEntropy += prob * calcShannonEnt(subDataSet)
        # 计算信息增益G(Y, X) = H(Y) - sum(H(Y|x))
        infoGain = baseEntropy - newEntropy
        if infoGain > bestInfoGain:
            bestInfoGain = infoGain
            bestFeature = i
    return bestFeature
接下来就是递归上面的代码,构建决策树了,上节提到,递归结束的条件一般是遍历完所有特征属性,或者到某个分支下仅有一个类别了,则得到一个叶子节点。但有时即使我们已经处理了所有的属性,但是在叶子节点时依旧没能将数据完全分开,在这种情况下,通常采用多数表决的方法决定该叶子节点所属类别。
def majorityCnt(classList):
    classCount = {}
    for vote in classList:
        if vote not in classCount.keys():
            classCount[vote] = 0
        classCount[vote] += 1
    # 按统计个数进行倒序排序
    sortedClassCount = sorted(classCount.items(), key=lambda item: item[1], reverse=True)
    return sortedClassCount[0][0]
然后就可以创建一颗决策树了,代码如下:
def creatTree(dataSet, labels):
    """
    labels为特征的标签列表
    """
    classList = [example[-1] for example in dataSet]
    # 如果data中的都为同一种类别,则停止,且返回该类别
    if classList.count(classList[0]) == len(classList):
        return classList[0]
    # 如果数据集中仅剩类别这一列了,即特征使用完,仍没有分开,则投票
    if len(dataSet[0]) == 1:
        return majorityCnt(classList)
    bestFeat = chooseBestFeatuerToSplit(dataSet)
    bestFeatLabel = labels[bestFeat]
    # 初始化树,用于存储树的结构,是很多字典的嵌套结构
    myTree = {bestFeatLabel: {}}
    # 已经用过的特征删去
    del (labels[bestFeatLabel])
    # 取出最优特征这一列的值
    featVals = [example[bestFeat] for example in dataSet]
    # 特征的取值个数
    uniqueVals = np.unique(featVals)
    # 开始递归分裂
    for value in uniqueVals:
        subLabels = labels[:]
        myTree[bestFeatLabel][value] = creatTree(splitData(dataSet, bestFeat, value), subLabels)
    return myTree
这样一颗决策树就构建完成了,使用上面那个小量的数据测试一下:
>>data
Out[1]: [[1, 1, 'yes'], [1, 1, 'yes'], [1, 0, 'no'], [0, 1, 'no'], [0, 1, 'no']]
>>labels
Out[2]: ['no surfacing', 'flippers']
>>creatTree(data, labels)
Out[3]: {'no surfacing': {0: 'no', 1: {'flippers': {0: 'no', 1: 'yes'}}}}
接下来要根据所建立的决策树,对新的样本进行分类,同样用到递归的方法:
def classify(inputTree, featLabels, testVec):
    # 自上而下搜索预测样本所属类别
    firstStr = inputTree.key()[0]
    secondDict = inputTree[firstStr]
    featIndex = featLabels.index(firstStr)
    for key in secondDict.keys():
        # 按照特征的位置确定搜索方向
        if testVec[featIndex] == key:
            if type(secondDict[key]).__name__ == 'dict':
                # 若下一级结构还是dict,递归搜索
                classLabel = classify(secondDict, featLabels, testVec)
            else:
                classLabel = secondDict[key]
    return classLabel
同时,还有对决策树的可视化,下面直接给出画图的代码
decisionNode = dict(boxstyle='sawtooth', fc="0.8")
leafNode = dict(boxstyle='round4', fc="0.8")
arrow_args = dict(arrowstyle='<-')


def plotNode(nodeTxt, centerPt, parentPt, nodeType):
    createPlot.ax1.annotate(nodeTxt, xy=parentPt, xycoords='axes fraction', xytext=centerPt, textcoords='axes fraction',
                            va="center", ha="center", bbox=nodeType, arrowprops=arrow_args)


def createPlot(inTree):
    fig = plt.figure(1, facecolor='white')
    fig.clf()
    axprops = dict(xticks=[], yticks=[])
    createPlot.ax1 = plt.subplot(111, frameon=False)
    plotTree.totalW = float(getNumLeafs(inTree))
    plotTree.totalD = float(getTreeDepth(inTree))
    plotTree.xOff = -0.5/plotTree.totalW
    plotTree.yOff = 1.0
    plotTree(inTree, (0.5, 1.0), '')
    # plotNode('a decision node', (0.5, 0.1), (0.1, 0.5), decisionNode)
    # plotNode('a leaf node', (0.8, 0.1), (0.3, 0.8), leafNode)
    plt.show()

def getNumLeafs(myTree):
    numLeafs = 0
    firstStr = list(myTree.keys())[0]
    secondDict = myTree[firstStr]
    for key in list(secondDict.keys()):
        if type(secondDict[key]).__name__ == 'dict':
            numLeafs += getNumLeafs(secondDict[key])
        else:
            numLeafs += 1
    return numLeafs


def getTreeDepth(myTree):
    maxDepth = 0
    firstStr = list(myTree.keys())[0]
    secondDict = myTree[firstStr]
    for key in list(secondDict.keys()):
        if type(secondDict[key]).__name__ == 'dict':
            thisDepth = 1 + getTreeDepth(secondDict[key])
        else:
            thisDepth = 1
        if thisDepth > maxDepth:
            maxDepth = thisDepth
    return maxDepth


def retrieveTree(i):
    listOfTrees = [{'no surfacing': {0: 'no', 1: {'flippers': {0: 'no', 1: 'yes'}}}},
                   ]
    return listOfTrees[i]


def plotMidText(cntrPt, parentPt, txtString):
    xMid = (parentPt[0] - cntrPt[0])/2.0 + cntrPt[0]
    yMid = (parentPt[1] - cntrPt[1])/2.0 + cntrPt[1]
    createPlot.ax1.text(xMid, yMid, txtString)


def plotTree(myTree, parentPt, nodeTxt):
    numLeafs = getNumLeafs(myTree)
    depth = getTreeDepth(myTree)
    firstStr = list(myTree.keys())[0]
    cntrPt = (plotTree.xOff + (1.0 + float(numLeafs))/2.0/plotTree.totalW, plotTree.yOff)
    plotMidText(cntrPt, parentPt, nodeTxt)
    plotNode(firstStr, cntrPt, parentPt, decisionNode)
    secondDict = myTree[firstStr]
    plotTree.yOff = plotTree.yOff - 1.0/plotTree.totalD
    for key in list(secondDict.keys()):
        if type(secondDict[key]).__name__ == 'dict':
            plotTree(secondDict[key], cntrPt, str(key))
        else:
            plotTree.xOff = plotTree.xOff + 1.0/plotTree.totalW
            plotNode(secondDict[key], (plotTree.xOff, plotTree.yOff), cntrPt, leafNode)
            plotMidText((plotTree.xOff, plotTree.yOff), cntrPt, str(key))
    plotTree.yOff = plotTree.yOff + 1.0/plotTree.totalD
运行createPlot函数,即可得到决策树的可视化,同样运用上面那个简单的数据集:
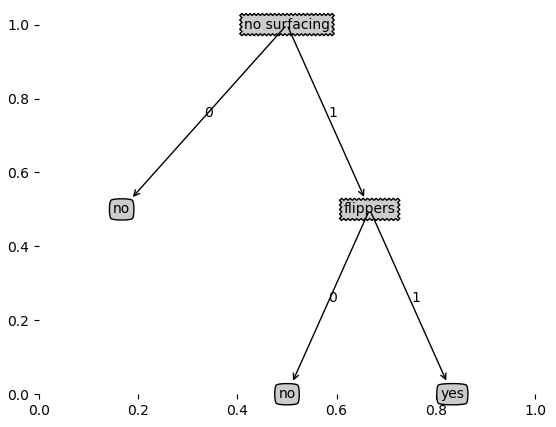
上面就是决策树的一个简单实现过程,下面我们运用“隐形眼镜数据集”对上面的模型进行测试,部分数据如下:
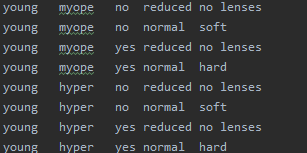
前四列是样本特征,最后一列为样本类别,运用上边的数据集,对模型进行测试:
fr = open('lenses.txt')
lenses = [inst.strip().split('\t') for inst in fr.readlines()]
lenses_labels = ['age', 'prescript', 'astigmatic', 'tearRate']
lenses_Tree = creatTree(lenses, lenses_labels)
createPlot(lenses_Tree)
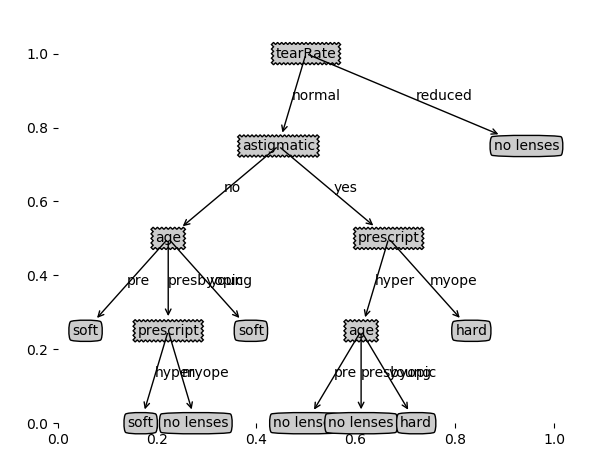
接下来就是对树的剪枝操作,这里主要方法是通过剪枝生成所有可能的树,然后利用测试集,选择最好的树(错误率最低)的树出来,首先建立用预测数据正确率和投票节点的函数:
def testing(myTree, data_test, labels):
    error = 0.0
    for i in range(len(data_test)):
        classLabel = classify(myTree, labels, data_test[i])
        if classLabel != data_test[i][-1]:
            error += 1
    return float(error)


# 测试投票节点正确率
def testingMajor(major, data_test):
    error = 0.0
    for i in range(len(data_test)):
        if major[0] != data_test[i][-1]:
            error += 1
    # print 'major %d' %error
    return float(error)
然后同样采用递归的方法,产生所有可能的决策树,然后舍弃掉错误率较高的树:
def postPruningTree(inTree, dataSet, test_data, labels):
    """
    :param inTree: 原始树
    :param dataSet:数据集
    :param test_data:测试数据,用于交叉验证
    :param labels:标签集
    """
    firstStr = list(inTree.keys())[0]
    secondDict = inTree[firstStr]
    classList = [example[-1] for example in dataSet]
    labelIndex = labels.index(firstStr)
    temp_labels = copy.deepcopy(labels)
    del (labels[labelIndex])
    for key in list(secondDict.keys()):
        if type(secondDict[key]).__name__ == 'dict':
            if type(dataSet[0][labelIndex]).__name__ == 'str':
                subDataSet = splitData(dataSet, labelIndex, key)
                subDataTest = splitData(test_data, labelIndex, key)
                if len(subDataTest) > 0:
                    inTree[firstStr][key] = postPruningTree(secondDict[key], subDataSet, subDataTest, copy.deepcopy(labels))
    if testing(inTree, test_data, temp_labels) < testingMajor(majorityCnt(classList), temp_labels):
        return inTree
    return majorityCnt(classList)
至此,一个简单的ID3决策树已经实现完成了,仅作为算法的理解过程,这里没有考虑连续型数据的处理问题,以及算法中很多不合理的地方。下面就使用python自带的sklearn进行决策树的建立,同时使用另一个比较著名的数据集——“红酒数据集”(数据集链接放在末尾)对建模过程进行了解。
首先导入决策树所需的包:
# 导入决策树包
from sklearn.tree import DecisionTreeClassifier
# 画图工具包
import matplotlib.pyplot as plt
import seaborn as sns
sns.set(color_codes=True)
# 导入数据处理的包
from sklearn.model_selection import train_test_split
# 模型评估
from sklearn import metrics
from sklearn.metrics import accuracy_score, f1_score, recall_score, precision_score
import missingno as msno_plot
然后是读取数据,并用describe函数对数据做一个初步的查看:
# 读取红酒数据
wine_df =pd.read_csv('/winequality-red.csv', sep=';')
# 查看数据, 数据有11个特征,类别为quality
wine_df.describe().transpose().round(2)
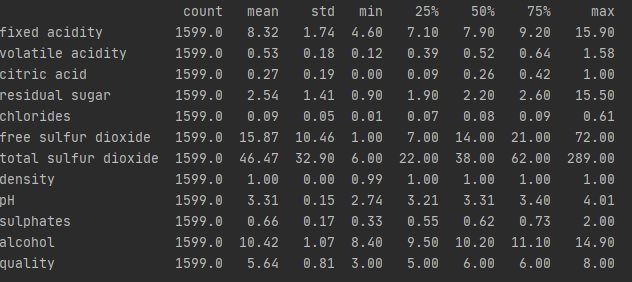
从统计样本count一列来看数据无缺失值,为更直观显示,画出缺失值直方图,如下:
plt.title('Non-missing values by columns')
msno_plot.bar(wine_df)
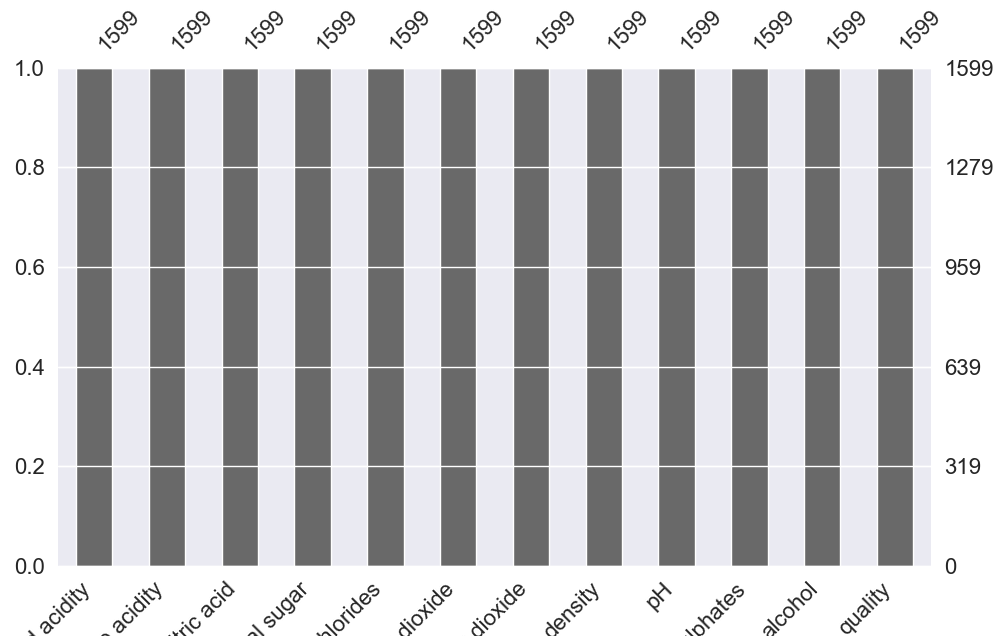
接下来就是异常值的检查,通过每一列数据的箱型图来查看是否存在偏离较远的异常值:
# 通过箱型图查看每一列的箱型图
plt.figure()
pos = 1
for i in wine_df.columns:
    plt.subplot(3, 4, pos)
    sns.boxplot(wine_df[i])
    pos += 1
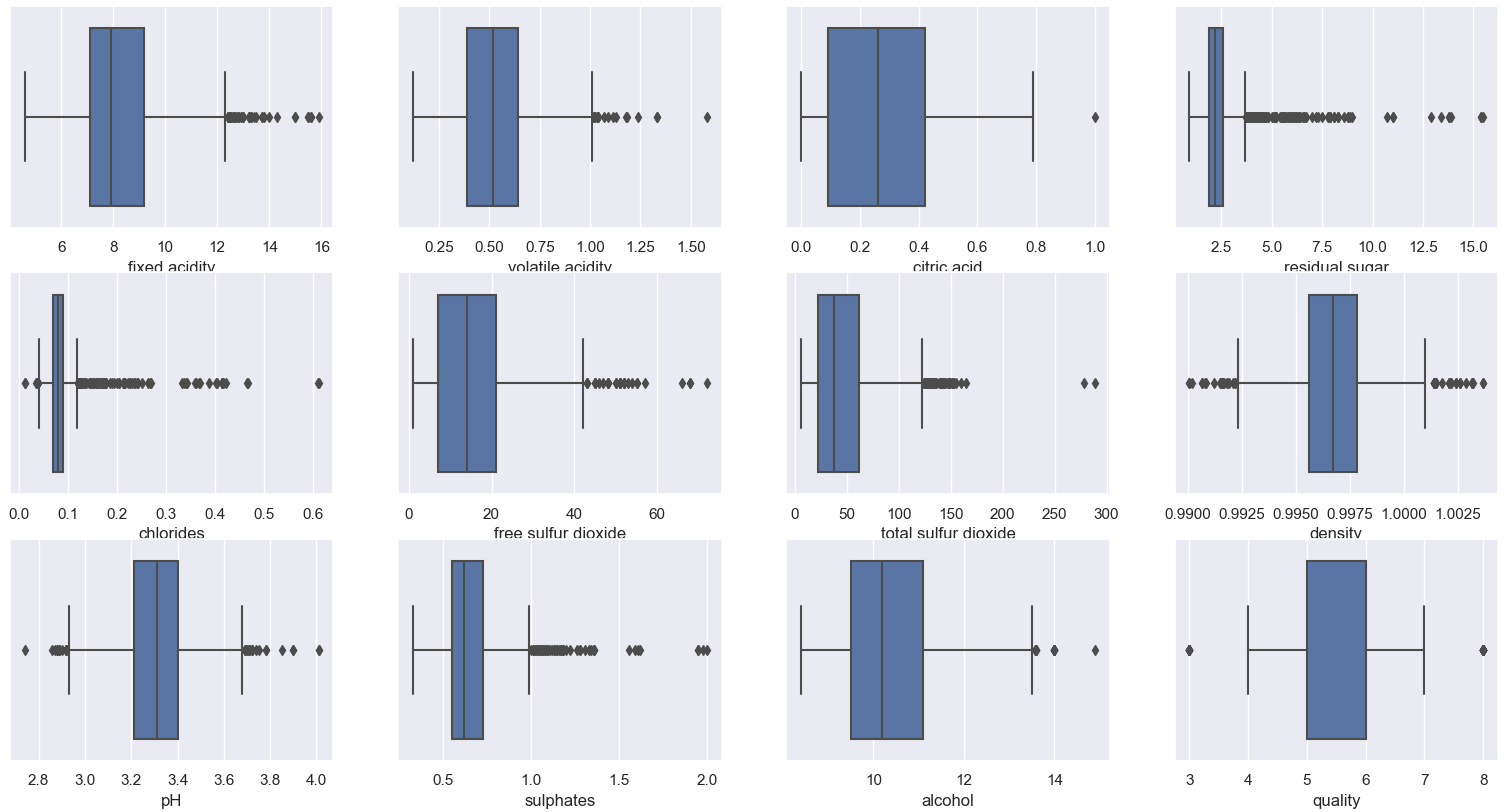
接下来处理异常值,在案例中采用样本的四分之一分位数、四分之三中位数组成的IQR四分位数间的范围来对偏离较远的点进行修正,代码如下:
# 处理缺失值
columns_name = list(wine_df.columns)
for name in columns_name:
    q1, q2, q3 = wine_df[name].quantile([0.25, 0.5, 0.75])
    IQR = q3 - q1
    lower_cap = q1 - 1.5*IQR
    upper_cap = q3 + 1.5*IQR
    wine_df[name] = wine_df[name].apply(lambda x: upper_cap if x > upper_cap else (lower_cap if (x<lower_cap) else x))
然后看下数据两两之间的相关性,sns.pairplot()是展现凉凉之间的线性、非线性和相关等关系。http://seaborn.pydata.org/generated/seaborn.pairplot.html
sns.pairplot(wine_df)
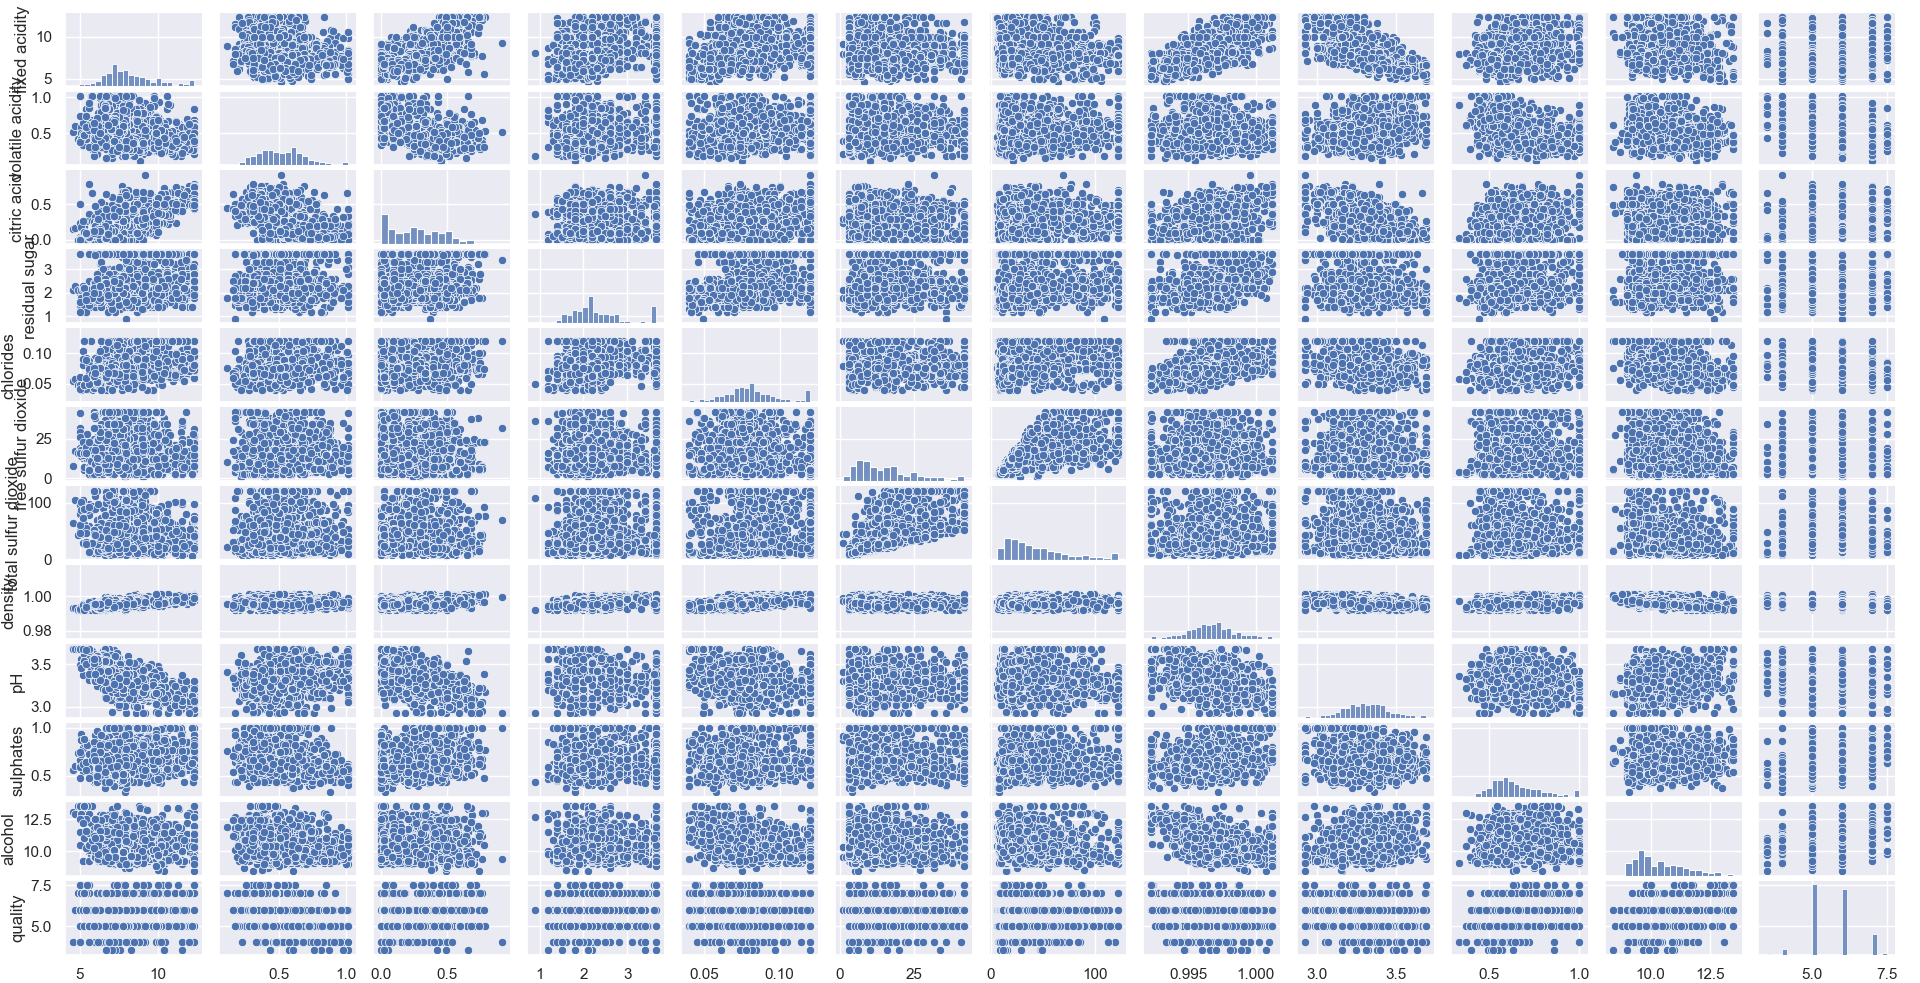
进一步查看两个变量相关性和关系,注意:在决策树中不需要删除高度相关的特征,因为节点只使用一个独立变量被划分为子节点,因此,即使两个变量高度相关,产生最高信息增益的变量也会用于分析。查看变量之间的相关性代码如下:
plt.figure(figsize=(10, 8))
sns.heatmap(wine_df.corr(), annot=True, linewidths=.5, center=0, cbar=False, cmap='YlGnBu')
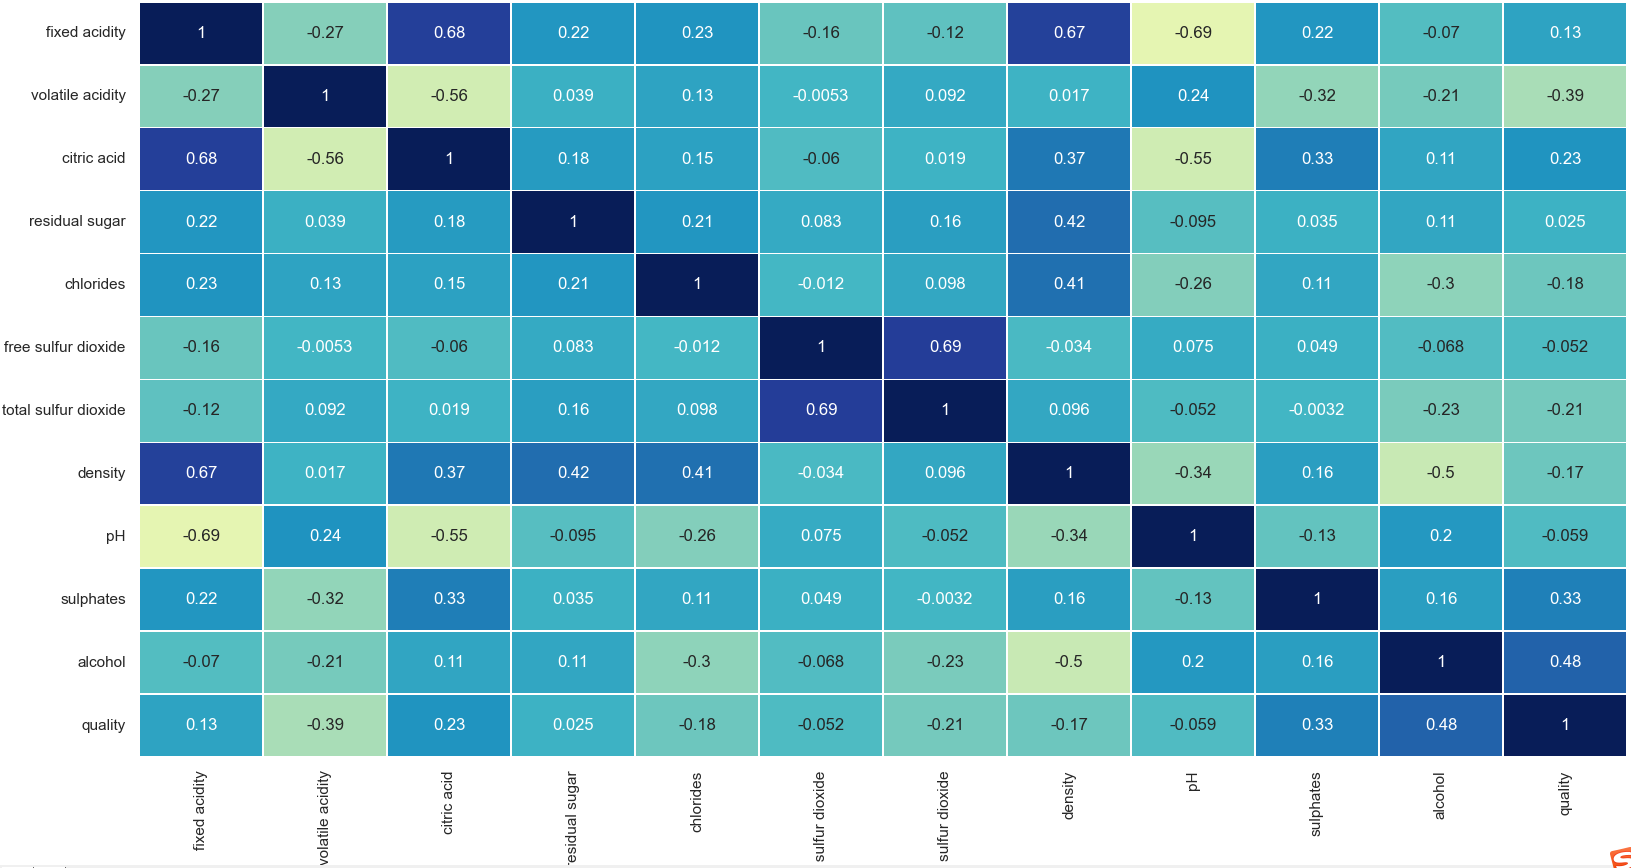
同时,分类问题对于类别的分布情况比较敏感,因此需要查看quality中各个类别的分布情况:
plt.figure(figsize=(10, 8))
sns.countplot(wine_df['quality'])

注意到这里类别中存在3.5连续型数值,要对其进行特殊处理,这里直接删去这一部分样本即可,因为样本量较少,可以看到类别分布相对不是很平衡,因此需要将类别平衡,通过将类别“quality”属性的值组合产生(或者其他的方法):
wine_df = wine_df[wine_df['quality'] != 3.5]
wine_df = wine_df[wine_df['quality'] != 7.5]
wine_df['quality'] = wine_df['quality'].replace(8, 7)
wine_df['quality'] = wine_df['quality'].replace(3, 5)
wine_df['quality'] = wine_df['quality'].replace(4, 5)
wine_df['quality'].value_counts(normalize=True)
接下来就是将数据分为训练集和测试两部分,测试集是为了检查模型的正确性和准确性,看是否欠拟合或者过拟合:
X_train, X_test, Y_train, Y_test = train_test_split(wine_df.drop(['quality'], axis=1), wine_df['quality'], test_size=0.3, random_state=22)
print(X_train.shape, X_test.shape)
Output:(1119, 11) (480, 11)
然后就是确定一个模型,模型及参数详解如下,具体参数解释可参考:https://www.cnblogs.com/hgz-dm/p/10886368.html
model = DecisionTreeClassifier(criterion='gini', random_state=100, max_depth=3, min_samples_leaf=5)
"""
criterion:度量函数,包括gini、entropy等
class_weight:样本权重,默认为None,也可通过字典形式制定样本权重,如:假设样本中存在4个类别,可以按照 [{0: 1, 1: 1}, {0: 1, 1: 5},
             {0: 1, 1: 1}, {0: 1, 1: 1}] 这样的输入形式设置4个类的权重分别为1、5、1、1,而不是 [{1:1}, {2:5}, {3:1}, {4:1}]的形式。
             该参数还可以设置为‘balance’,此时系统会按照输入的样本数据自动的计算每个类的权重,计算公式为:n_samples/( n_classes*np.bincount(y)),
             其中n_samples表示输入样本总数,n_classes表示输入样本中类别总数,np.bincount(y) 表示计算属于每个类的样本个数,可以看到,
             属于某个类的样本个数越多时,该类的权重越小。若用户单独指定了每个样本的权重,且也设置了class_weight参数,则系统会将该样本单独指定
             的权重乘以class_weight指定的其类的权重作为该样本最终的权重。
max_depth: 设置树的最大深度,即剪枝,默认为None,通常会限制最大深度防止过拟合一般为5~20,具体视样本分布来定
splitter: 节点划分策略,默认为best,还可以设置为random,表示最优随机划分,一般用于数据量较大时,较小运算量
min_sample_leaf: 指定的叶子结点最小样本数,默认为1,只有划分后其左右分支上的样本个数不小于该参数指定的值时,才考虑将该结点划分也就是说,
                 当叶子结点上的样本数小于该参数指定的值时,则该叶子节点及其兄弟节点将被剪枝。在样本数据量较大时,可以考虑增大该值,提前结束树的生长。
random_state: 当splitter设置为random时,可以通过该参数设计随机种子数
min_sample_split: 对一个内部节点划分时,要求该结点上的最小样本数,默认为2
max_features: 划分节点时,所允许搜索的最大的属性个数,默认为None,auto表示最多搜索sqrt(n)个属性,log2表示最多搜索log2(n)个属性,也可以设置整数;
min_impurity_decrease :打算划分一个内部结点时,只有当划分后不纯度(可以用criterion参数指定的度量来描述)减少值不小于该参数指定的值,才会对该
                       结点进行划分,默认值为0。可以通过设置该参数来提前结束树的生长。
min_impurity_split : 打算划分一个内部结点时,只有当该结点上的不纯度不小于该参数指定的值时,才会对该结点进行划分,默认值为1e-7。该参数值0.25
                     版本之后将取消,由min_impurity_decrease代替。
"""
接下来就是利用训练数据对模型进行训练:
model.fit(X_train, Y_train)
然后就是查看模型,并对画出训练出来的决策树(这里卡了很久,网上有很多解决办法,在一台电脑成功显示,但另一台总有问题):
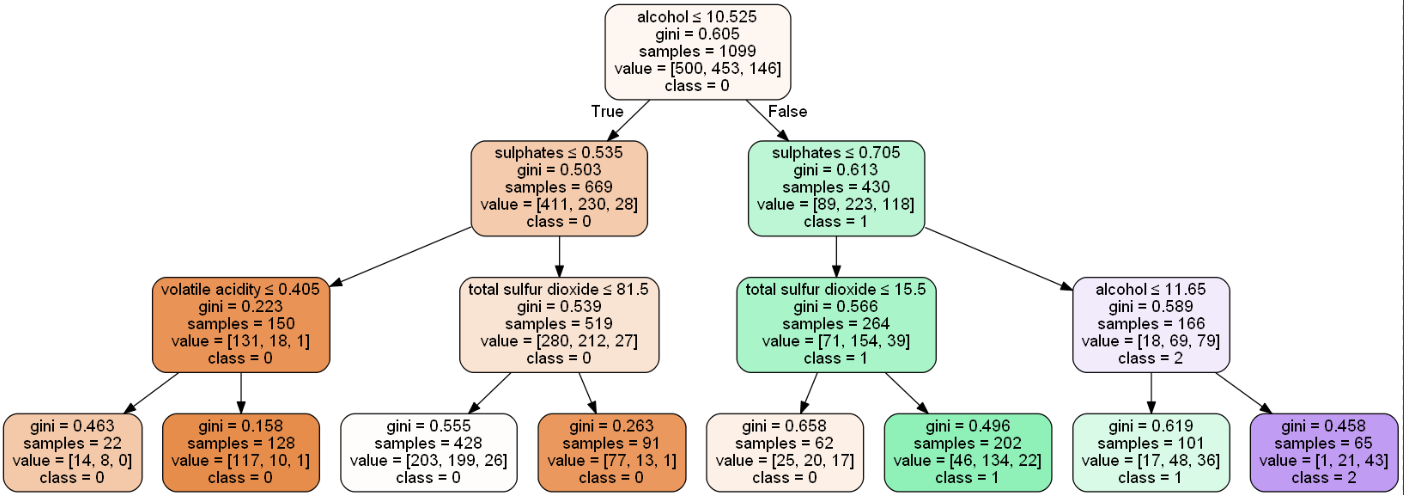
然后查看模型在训练集和测试集上的准确率:
test_labels = model.predict(X_test)
train_labels = model.predict(X_train)
print('测试集上的准确率为%s'%accuracy_score(Y_test, test_labels))
print('训练集上的准确率为%s'%accuracy_score(Y_train, train_labels))
测试集上的准确率为0.6101694915254238
训练集上的准确率为0.6014558689717925
查看每个特征对于样本分类的重要性程度:
feat_importance = model.tree_.compute_feature_importances(normalize=False)
feat_imp_dict = dict(zip(feature_cols, model.feature_importances_))
feat_imp = pd.DataFrame.from_dict(feat_imp_dict, orient='index')
feat_imp.rename(columns={0: 'FeatureImportance'}, inplace=True)
feat_imp.sort_values(by=['FeatureImportance'], ascending=False).head()
Output:
                                 FeatureImportance
alcohol                        0.507726
sulphates                      0.280996
total sulfur dioxide           0.190009
volatile acidity               0.021269
fixed acidity                  0.000000
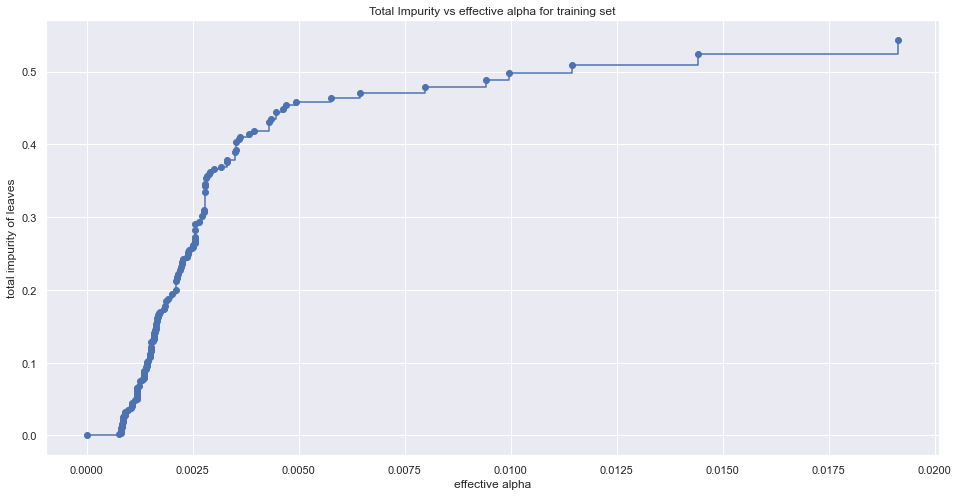
前面建模时有提到一些参数如max_depth、min_samples_leaf等参数决定树的提前终止来防止过拟合,而在实际应用中想要找出最佳的一组参数并不容易(但也不是不可能,可以通过GridSearchCV的方法对模型进行模型),另一种在上一节中提到的后剪枝算法,即确定不同的α值,找出最优的决策树,下面看一下α值的变化与数据数据不纯度的变化关系:
path = model.cost_complexity_pruning_path(X_train, Y_train)
ccp_alphas, impurities = path.ccp_alphas, path.impurities

fig, ax = plt.figure(figsize=(16, 8))
ax.plot(ccp_alphas[:-1], impurities[:-1], marker='o', drawstyle='steps-post')
ax.set_xlabel('effective alpha')
ax.set_ylabel('total impurity of leaves')
# 根据不同的alpha生成不同的树并保存
clfs = []
for ccp_alpha in ccp_alphas:
    clf = DecisionTreeClassifier(random_state=0, ccp_alpha=ccp_alpha)
    clf.fit(X_train, Y_train)
    clfs.append(clf)
# 删去最后一个元素,因为最后只有一个节点
clfs = clfs[:-1]
ccp_alphas = ccp_alphas[:-1]

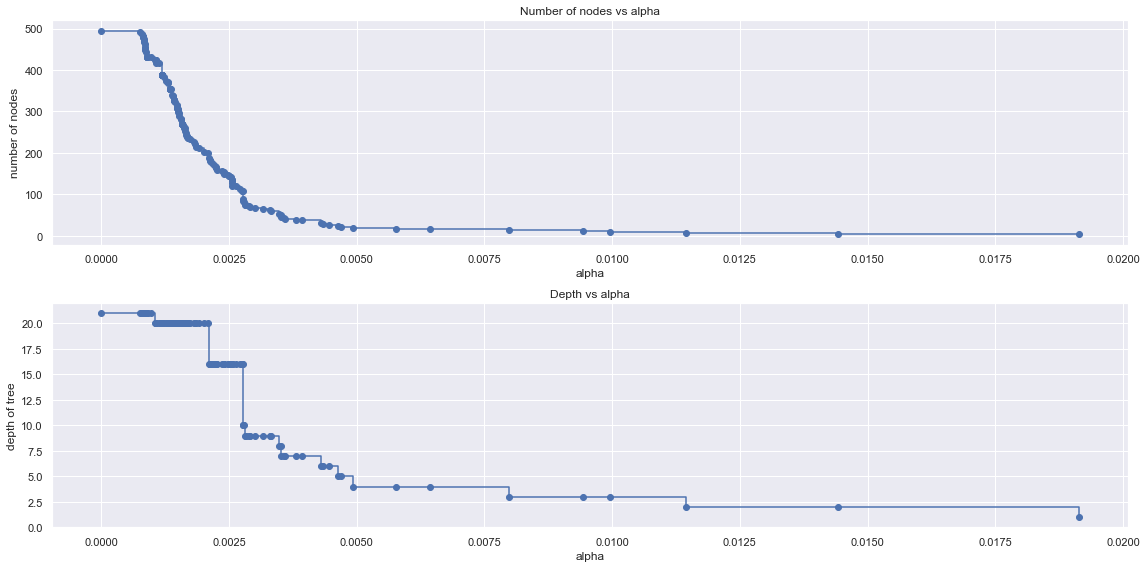
# 查看树的总节个点数和树的深度随alpha的变化
node_counts = [clf.tree_.node_count for clf in clfs]
depth = [clf.tree_.max_depth for clf in clfs]
fig, ax = plt.subplot(2, 1)
ax[0].plot(ccp_alphas, node_counts, marker='o', drawstyle='steps-post')
ax[0].set_xlabel('alpha')
ax[0].set_ylabel('number of nodes')
ax[0].set_title("Number of nodes vs alpha")
ax[1].plot(ccp_alphas, depth, marker='o', drawstyle='steps-post')
ax[1].set_xlabel('alpha')
ax[1].set_ylabel('depth of Tree')
ax[1].set_title("Depth vs alpha")
fig.tight_layout()
# 查看不同树的训练误差和测试误差变化关系
train_scores = [clf.score(X_train, Y_train) for clf in clfs]
test_scores = [clf.score(X_test, Y_test) for clf in clfs]

fig, ax = plt.subplots()
ax.plot(ccp_alphas, train_scores, marker='o', label='train', drawstyle='steps-post')
ax.plot(ccp_alphas, test_scores, marker='o', label='test', drawstyle='steps-post')
ax.set_xlabel('alpha')
ax.set_ylabel('accuracy')
ax.legend()
plt.show()
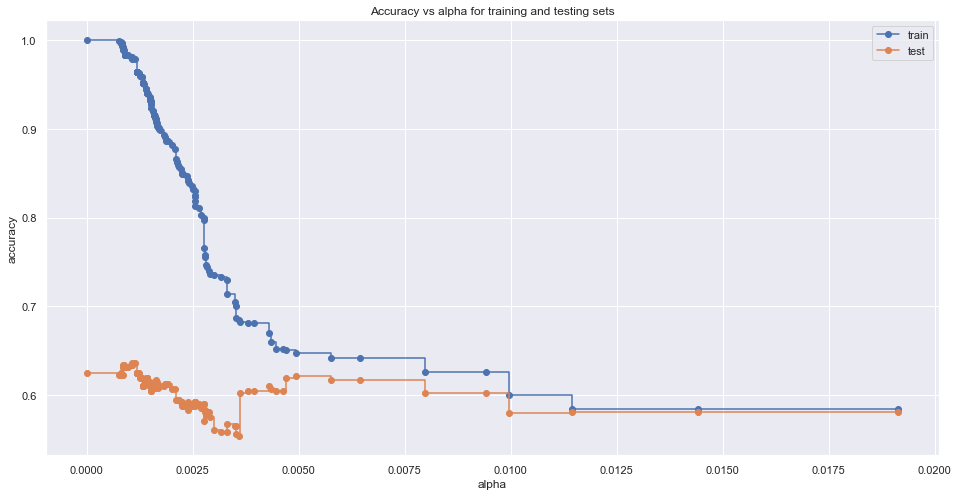
根据上述比较,可以选出最优的α和对应的模型:
i = np.arange(len(ccp_alphas))
ccp = pd.DataFrame({'Depth': pd.Series(depth, index=i), 'Node': pd.Series(node_counts, index=i),
                    'ccp': pd.Series(ccp_alphas, index=i), 'train_scores': pd.Series(train_scores, index=i),
                    'test_scores': pd.Series(test_scores, index=i)})
ccp.tail()
best = ccp[ccp['test_scores'] == ccp['test_scores'].max()]
参考文献:
官方文档:http://seaborn.pydata.org/generated/seaborn.pairplot.html
博客:https://www.cnblogs.com/panchuangai/p/13445819.html
博客:https://www.cnblogs.com/hgz-dm/p/10886368.html
官方文档:https://scikit-learn.org/stable/auto_examples/tree/plot_cost_complexity_pruning.html
至此,一个简单的决策树案例就算完成了,在实现的过程中也踩了很多坑,有的由于软件和package版本的问题,没有调通,后面再进一步去调,上面建模过程也是其他机器学习的一个较为通用建模流程,不过在数据的处理过程中根据需求有所不同,在此有了一个初步的了解。接下来就是由决策树延伸至集成学习的相关内容了。


【推荐】国内首个AI IDE,深度理解中文开发场景,立即下载体验Trae
【推荐】编程新体验,更懂你的AI,立即体验豆包MarsCode编程助手
【推荐】抖音旗下AI助手豆包,你的智能百科全书,全免费不限次数
【推荐】轻量又高性能的 SSH 工具 IShell:AI 加持,快人一步
· .NET Core 中如何实现缓存的预热?
· 从 HTTP 原因短语缺失研究 HTTP/2 和 HTTP/3 的设计差异
· AI与.NET技术实操系列:向量存储与相似性搜索在 .NET 中的实现
· 基于Microsoft.Extensions.AI核心库实现RAG应用
· Linux系列:如何用heaptrack跟踪.NET程序的非托管内存泄露
· TypeScript + Deepseek 打造卜卦网站:技术与玄学的结合
· 阿里巴巴 QwQ-32B真的超越了 DeepSeek R-1吗?
· 【译】Visual Studio 中新的强大生产力特性
· 10年+ .NET Coder 心语 ── 封装的思维:从隐藏、稳定开始理解其本质意义
· 【设计模式】告别冗长if-else语句:使用策略模式优化代码结构