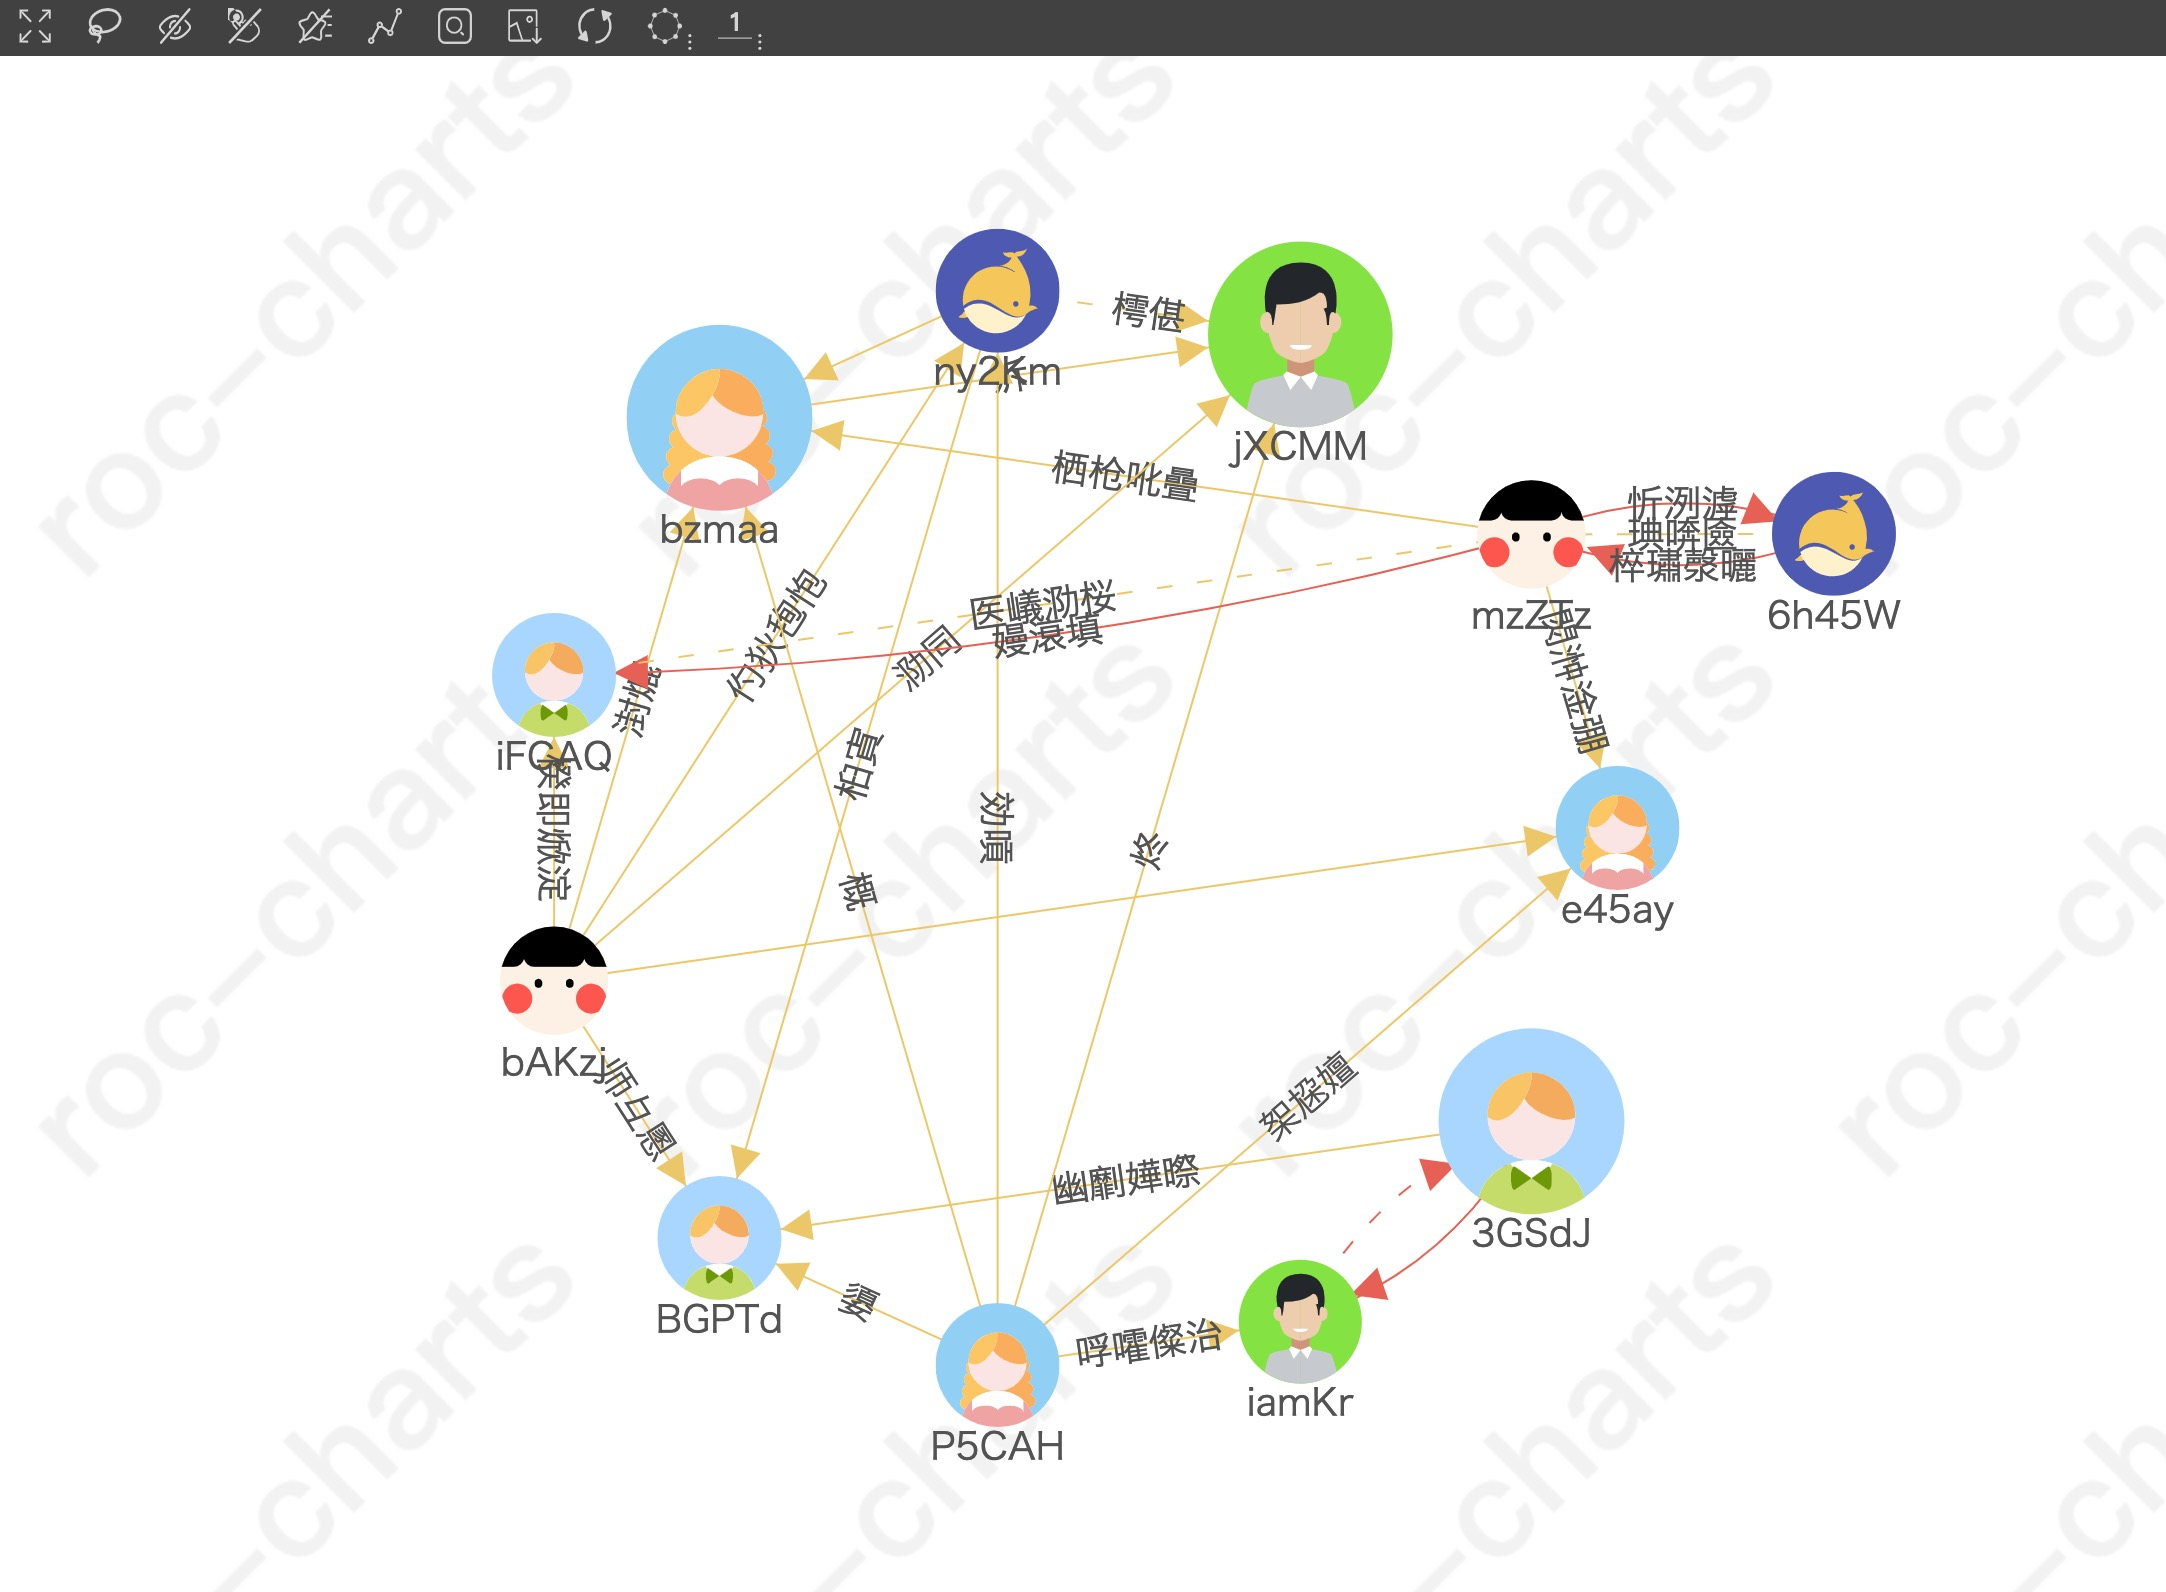
roc-charts 开源的轻量级关系图谱框架
此框架基于 zrender 开发,用于展现节点之间的关系。关系的呈现(图谱布局)主要还是由使用者决定,可以很简单的将自己的布局算法加入到此框架中,而框架更多的作用是实现图谱操作功能,此框架内置了一些常用功能,也提供了插件机制可供开发更多功能。

框架的使用:
yarn add roc-charts 或 npm install roc-charts
import Chart from 'roc-charts;

const chart = new Chart({
    id: 'chart',  // 绘制图谱 dom 的 id
    type: 'force',  // 图谱类型
    data: chartData,  // 图谱数据
});
chart.init(config);  // 调用 init 方法绘图,配置项可选
支持自定义图布局和插件:
自定义图谱:
import Chart, { ChartBase } from 'roc-charts';

// 创建自己的图谱布局类。继承 ChartBase,通过 compute 方法计算坐标
class CustomChart extends ChartBase {
    // 必须的静态属性,图谱中会用到
    static chartName = 'customChart';  // 设置图谱的名称,初始化图谱及切换图谱使用
    static chartZhName = '自定义图谱';  // 设置中文名称,切换图谱插件中鼠标悬停显示
    static icon = icon;  // 设置 dataURI 图标,切换图谱插件使用

    // compute 方法中获取 store,通过算法修改 store 中 nodes 的 position 实现自定义图谱布局
    compute() {
        const { nodes } = this.$store;
        // 修改节点的 position 即可
        nodes.forEach((node, i) => {
            const x = positions[i].x;
            const y = positions[i].y;
            node.position = [x, y];
        });
    }
}
// 通过 registerChart 方法注册自定义图谱即可使用
Chart.registerChart(CustomChart);

const chart = new Chart({
    id: 'xx',
    type: 'customChart',  // 上面设置的图谱名称
    data
});
自定义插件:
import Chart, { PluginBase } from 'roc-charts';

class CustomPlugin extends PluginBase {
    // 设置插件的名称
    static pluginName = 'customPlugin';

    // 实现插件功能
    init() {
        ...
    }
}
// 注册自定义插件
Chart.registerPlugin(CustomPlugin);
此框架已开源在 github 上,喜欢的点个星星~
项目地址:https://github.com/hepeng10/roc-charts
在线 Demo:https://hepeng10.github.io/roc-charts-demo/#/
在线文档:https://hepeng10.github.io/roc-charts-document/


