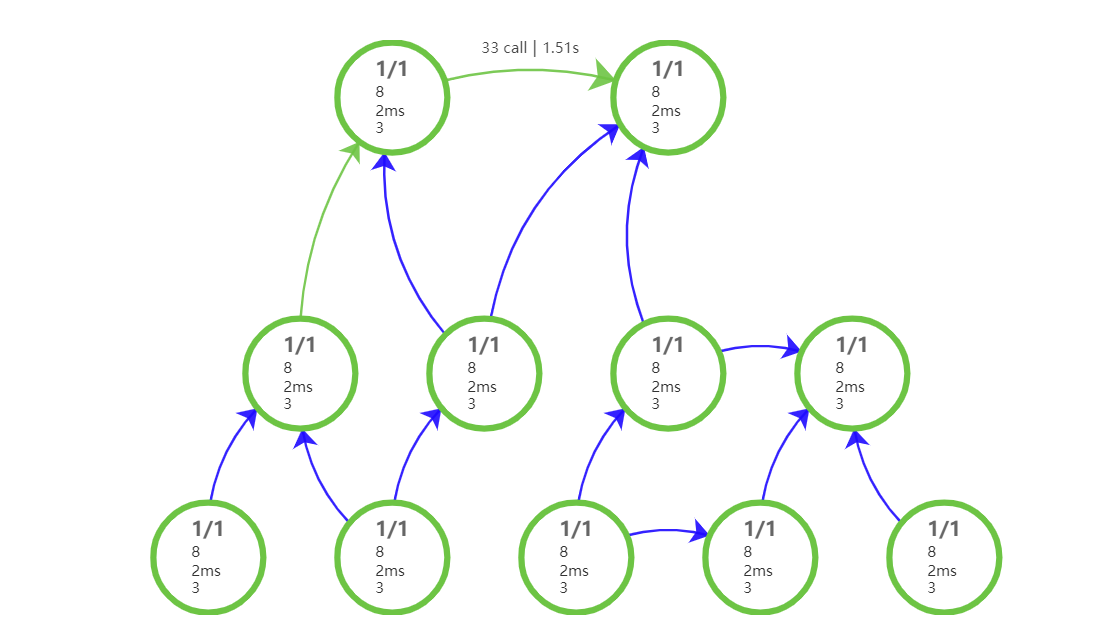
echars关系图

`drawLine () {
// 基于准备好的dom,初始化echarts实例
const chartDom = document.getElementById('main')
const myChart = echarts.init(chartDom)
  // 指定图表的配置项和数据
  const option = {
    tooltip: {},

    legend: {
      icon: 'circle',
      // 修改样式
      x: 'center',
      bottom: '15' // 距下边距
    },
    color: ['#fff', '#5ec54a', '#4cabce', '#e5323e'],
    toolbox: {
      show: true,
      feature: {
        saveAsImage: {}
      },
      roam: false
    },
    animationDurationUpdate: 1500,
    animationEasingUpdate: 'quinticInOut',
    series: [
      {
        backgroundColor: 'red',
        borderColor: 'red',
        type: 'graph',
        layout: 'none',
        symbolSize: 88, // 控制圆圈的大小
        roam: false, // 禁止缩放
        label: {
          show: true,
          position: 'inside', // 文本位置
          formatter: function (para) {
            // console.log(para)  //节点上的数据
            // return '\n' + '{txtFontsize|' + para.data.name + '}' + '\n' + '{cnNum|' + para.data.value[2] + '}'
            return ['{a|1/1}', '{b|8}', '{c|2ms}', '{d|3}'].join('\n')
          },
          rich: { // 文本的样式
            a: {
              color: '#666',
              lineHeight: 20,
              fontWeight: 700,
              fontSize: 16
            },
            b: {
              lineHeight: 15
            },
            c: {
              lineHeight: 15
            }
          }
        },
        edgeSymbol: ['circle', 'arrow'],
        edgeSymbolSize: [0, 15],
        edgeLabel: {
          fontSize: 14
        },
        data: [
          {
            name: '节点1',
            x: 500,
            y: -600,
            // 节点的样式
            itemStyle: {
              borderType: 'solid',
              // color: "red",
              borderColor: '#5ec54a',
              borderWidth: 5
            },
            // 鼠标移入该节点的样式
            emphasis: {
              focus: 'adjacency',
              lineStyle: {
                width: 6,
                symbolSize: [5, 20]
              },
              itemStyle: {
                borderType: 'solid',
                color: 'pink',
                borderColor: '#5EC54A',
                borderWidth: 5
              }
            }
          },
          {
            name: '节点2',
            x: 800,
            y: -600,
            itemStyle: {
              borderType: 'solid',
              // color: "red",
              borderColor: '#5ec54a',
              borderWidth: 5
            }
          },
          {
            name: '节点3',
            x: 400,
            y: -300,
            itemStyle: {
              borderType: 'solid',
              // color: "red",
              borderColor: '#5ec54a',
              borderWidth: 5
            }
          },
          {
            name: '节点4',
            x: 600,
            y: -300,
            itemStyle: {
              borderType: 'solid',
              // color: "red",
              borderColor: '#5ec54a',
              borderWidth: 5
            }
          },
          {
            name: '节点5',
            x: 800,
            y: -300,
            itemStyle: {
              borderType: 'solid',
              // color: "red",
              borderColor: '#5ec54a',
              borderWidth: 5
            }
          },
          {
            name: '节点6',
            x: 1000,
            y: -300,
            itemStyle: {
              borderType: 'solid',
              // color: "red",
              borderColor: '#5ec54a',
              borderWidth: 5
            }
          },
          {
            name: '节点7',
            x: 300,
            y: -100,
            itemStyle: {
              borderType: 'solid',
              // color: "red",
              borderColor: '#5ec54a',
              borderWidth: 5
            }
          },
          {
            name: '节点8',
            x: 500,
            y: -100,
            itemStyle: {
              borderType: 'solid',
              // color: "red",
              borderColor: '#5ec54a',
              borderWidth: 5
            }
          },
          {
            name: '节点9',
            x: 700,
            y: -100,
            itemStyle: {
              borderType: 'solid',
              // color: "red",
              borderColor: '#5ec54a',
              borderWidth: 5
            }
          },
          {
            name: '节点10',
            x: 900,
            y: -100,
            itemStyle: {
              borderType: 'solid',
              // color: "red",
              borderColor: '#5ec54a',
              borderWidth: 5
            }
          },
          {
            name: '节点11',
            x: 1100,
            y: -100,
            itemStyle: {
              borderType: 'solid',
              // color: "red",
              borderColor: '#5ec54a',
              borderWidth: 5
            }
          }
        ],
        // 连接
        links: [
          {
            source: 0, // 是数字时表示节点的索引
            target: 1,
            symbolSize: [5, 20],
            // 连接上的文字
            label: {
              show: true,
              formatter: ['{a|33 call}', '{b|1.51s}'].join(' | '),
              rich: {
                a: {
                  // color: '#000',
                  lineHeight: 1
                },
                b: {
                  height: 20
                }
              }
            },
            // 连接的样式,可单独写在连接中
            lineStyle: {
              curveness: 0.2,
              opacity: 0.9,
              width: 2,
              color: '#5ec54a'
            }
          },
          {
            source: '节点3',
            target: '节点1', // 文字必须和data中的name值一致
            lineStyle: {
              curveness: 0.2,
              opacity: 0.9,
              width: 2,
              color: '#5ec54a'
            }
          },
          {
            source: '节点4',
            target: '节点1'
          },
          {
            source: '节点4',
            target: '节点2'
          },
          {
            source: '节点5',
            target: '节点2'
          },
          {
            source: '节点5',
            target: '节点6'
          },
          {
            source: '节点7',
            target: '节点3'
          },
          {
            source: '节点8',
            target: '节点3'
          },
          {
            source: '节点8',
            target: '节点4'
          },
          {
            source: '节点9',
            target: '节点5'
          },
          {
            source: '节点9',
            target: '节点10'
          },
          {
            source: '节点10',
            target: '节点6'
          },
          {
            source: '节点11',
            target: '节点6'
          }
        ],
        // 连接的样式,可单独写在连接中
        lineStyle: {
          opacity: 0.9,
          width: 2,
          curveness: 0.3,
          color: 'blue'
        },
        // 鼠标移入动态的时候显示的默认样式,可单独写在每项下,写在全局就是公共的
        emphasis: {
          focus: 'adjacency',
          lineStyle: {
            width: 6,
            symbolSize: [5, 20]
          },
          itemStyle: {
            borderType: 'solid',
            color: '#B3E69F',
            borderColor: '#5EC54A',
            borderWidth: 5
          }
        }
      }
    ]
  }
  // 使用刚指定的配置项和数据显示图表。
  myChart.setOption(option)
  // 点击出现弹框
  myChart.on('mouseover', param => {
    param.event.event.stopPropagation()
    console.log('param---->', param) // 打印出param, 可以看到里边有很多参数可以使用
    // 获取节点点击的数组序号
    var arrayIndex = param.dataIndex
    console.log('arrayIndex---->', arrayIndex)
    console.log('name---->', param.name)
    console.log(param.dataType)
    if (param.dataType === 'node') {
      //   alert('点击了节点' + param.name)
      this.dialogServeVisible = true
      this.dialogConnectVisible = false
    } else {
    //   alert('点击了边' + param.value)
      this.dialogServeVisible = false
      this.dialogConnectVisible = true
    }
  })
  myChart.on('mouseout', param => {
    this.dialogServeVisible = false
    this.dialogConnectVisible = false
  })
}`


