解决plt中文乱码 RuntimeWarning_ Glyph 24402 missing from current font. font.set_text(s, 0, flags=flags)
mean1,mean2,mean3=avgSlove(X,y)

label_list = ['色调', '红色均值', '相对红色分量', '粗度','高频能量']    # 横坐标刻度显示值
xx = range(len(label_list))
rects1 = plt.bar(x=xx, height=mean1, width=0.4, alpha=0.8,align='edge', color='blue')
plt.ylim(0, 1)     # y轴取值范围
plt.ylabel("归一化后的值")
plt.xticks([index + 0.2 for index in xx], label_list)
plt.xlabel("特征")
plt.show()
如上代码产生了如下结果
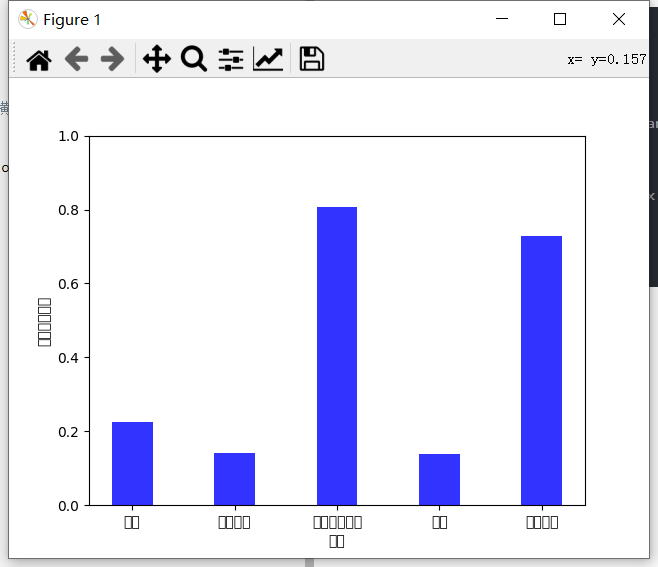
中文的横坐标没弄出来,控制台报 RuntimeWarning: Glyph 24402 missing from current font. font.set_text(s, 0, flags=flags)
查阅资料 https://github.com/matplotlib/matplotlib/issues/15062 发现应该问题是Matplotlib无法正确找到字体并回退到不支持汉字的字体。
https://www.programmersought.com/article/93394200127/ 找到了解决办法
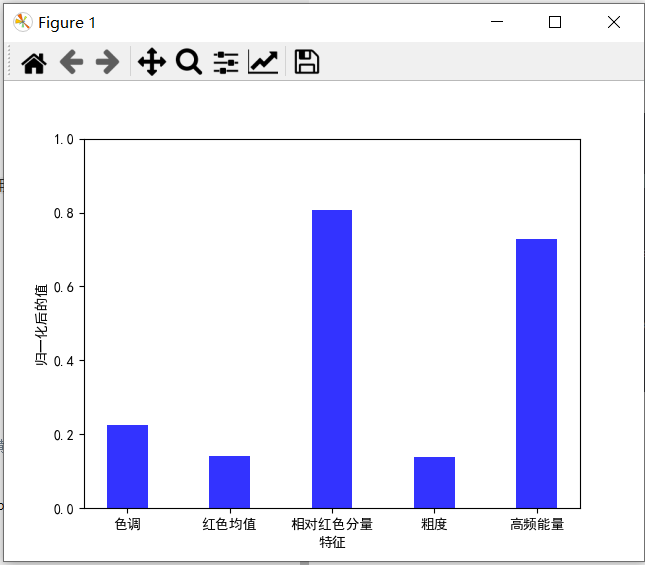
解决办法
添加 plt.rcParams['font.sans-serif']=['SimHei'] #用来正常显示中文标签
mean1,mean2,mean3=avgSlove(X,y)

plt.rcParams['font.sans-serif']=['SimHei'] #用来正常显示中文标签
label_list = ['色调', '红色均值', '相对红色分量', '粗度','高频能量']    # 横坐标刻度显示值
xx = range(len(label_list))
rects1 = plt.bar(x=xx, height=mean1, width=0.4, alpha=0.8,align='edge', color='blue')
plt.ylim(0, 1)     # y轴取值范围
plt.ylabel("归一化后的值")
plt.xticks([index + 0.2 for index in xx], label_list)
plt.xlabel("特征")
plt.show()