

Prometheus
Prometheus
谷歌提出应该监控的指标
- 延迟
- 流量
- 错误
- 饱和 未处理的工作量,通常在队列中
架构图
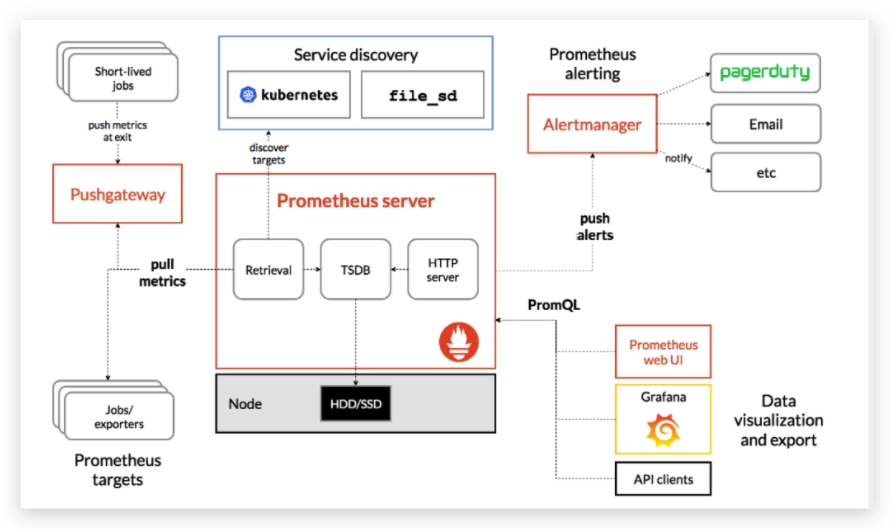
prometheus
数据流流向
- 内存
最新的数据保存在内存中2h,这包括2h时间窗口期间收集的一个或多个数据块,减少了磁盘IO的消耗。最新数据存储在内存中,查询速度快,数据库在内存中创建,避免持续的磁盘写操作。
- 预写日志
在内存中,数据不是持久的,进程非正常终止,数据可能会丢失。防止这种情况,磁盘上的write-ahead log(WAL)日志会保持内存数据的状态,以便在prometheus因任何原因崩溃或者重新启动时可以重播。
- 磁盘
2h时间窗口之后,快被写入磁盘,这些块不可变,即使数据可以删除,他也不是原子操作,
数据类型
Counter
只增不减的计数器,描述某个指标的累积状态,如请求量统计。
计数器,只增不减。最多保持不变,不可能下降。
Gauge
可增可减的计量器。某个指标的当前状态,如系统内存余量。
瞬时状态,随着时间不断变化的。变化没有规律,可多可少。
Histogram
直方图,描述指标的分布情况。如请求的响应时间,总共10w请求,小于10ms的5w个,小于50ms的9w个,小于100ms的9.9w个。
Summary
同上,描述指标的分布情况。如请求响应时间,总10w个请求,50%小于10ms,90%小于50ms,99%小于100ms。百分数计算。
Histogram使用场景较多,因为对资源需求更少,但是在查询的时候,his资源消耗比sum更多。
安装&启动
# docker 部署
docker run -itd --name prome  -p 9090:9090 \
-v /prometheus/prometheus.yml:/etc/prometheus/prometheus.yml \
prom/prometheus

# 虚拟机部署
./prometheus
# nohup command > myout.file 2>&1 &

# 后台运行2个方法
1、screen
ctl+a, ctl+d # 退出screen 后台运行
screen -ls
screen -r id # 重新进入会话

2、daemonize
daemonize  -c /data/prometheus  /data/prometheus/up.sh
# -c 指定运行路径

# up.sh内容
/data/prometheus/prometheus --web.listen-address="0.0.0.0:9090" --web.read-timeout=5m --web.max-connections=10
--storage.tsdb.retention=15d --storage.tsdb.path='data/' --query.max-concurrency=20 --query.timeout=2m
# prometheus.yml
# 全局配置
global:
  scrape_interval: 15s # Set the scrape interval to every 15 seconds. Default is every 1 minute.
  evaluation_interval: 15s # Evaluate rules every 15 seconds. The default is every 1 minute.

alerting:
  alertmanagers:
    - static_configs:
        - targets:
          # - alertmanager:9093

rule_files:
  # - "first_rules.yml"
  # - "second_rules.yml"

scrape_configs:
  # The job name is added as a label `job=<job_name>` to any timeseries scraped from this config.
  - job_name: "prometheus"

    static_configs:
      - targets: ["localhost:9090"]
启动配置&启动参数
5.1、启动命令参数
--config 指定prometheus配置文件路径。默认当前目录。
--web.read-timeout 请求链接的最大等待时间 防止太多空闲链接 占有资源
--storage.tsdb.path 指定数据存储的路径,默认当前目录的data/目录。
--storage.tsdb.retention=15d 监控数据保留期限
--web.external-url 指定prometheus服务器的url地址
--web.enable-admin-api 选项启用的话,可以通过http端点执行一些高级管理操作,如创建数据快照,删除时间序列数据。
--web.enable-lifecycle 不重启prometheus即可重新加载配置
--web.max-connections=512 # 最大连接数
--log.level=info # 日志信息级别
如何调优查询引擎的内部工作方式。
比如给定的查询在中止之前可以运行多长时间
--query.timeout=2m (2m内返回不了数据,直接超时)。
--query.max-concurrency=20 设置并发查询多少
5.2、配置文件解析
全局配置
global:
  scrape_interval: 15s  # 抓取度量的间隔值 通常10s-1min
  scrape_timeout: 10s  # 采集度量的等待时间
  evaluation_interval: 15s # 评估警告的间隔
  external_labels: # 给数据打上标签
    dc: dc1
    prom: prom1
  # scrape_timeout is set to the global default (10s).
scrape_configs
scrape_configs:
  - job_name: "prometheus"
    scrape_interval: 5s # 目标抓取间隔
    scrape_timeout: 10s
    metrics_path: /metrics # metrics路径 可自定义
    # scheme: https
    static_configs:
      - targets: ["localhost:9090"]
标签
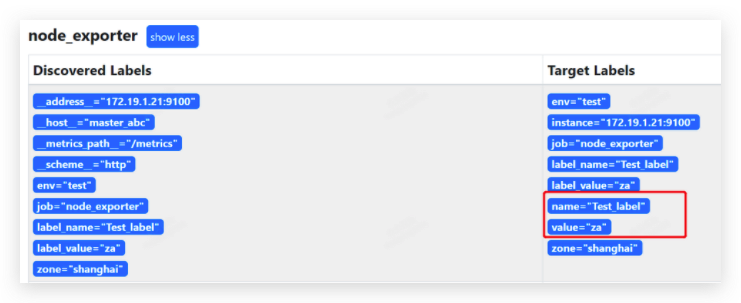
默认情况下,prometheus加载target实例完成后,这些target会包含一些默认的标签,这些标签会告诉prometheus如何从target实例中获取监控数据。
发生在采集样本数据之前,对target实例的标签进行重写的机制在prome被称为Relabeling。prome允许用户在采集任务设置中通过relabel_configs来添加自定义的Relabeling。
prome从数据源拉取数据后,会对原始数据进行编辑,其中metric_relabel_configs是prome在保存数据前的最好一步标签重新编辑(relabel_configs)。metric_relabel_configs常用的用途是将监控不需要的数据丢掉,不在prome中保存。

系统默认标签
__address__ 当前target实例访问地址 host:port
__scheme__  当前目标服务器访问地址的http scheme ,http或https
__metrics_path__  采集目标服务器访问地址的访问路径
__param__  采集目标服务器只能够包含的请求参数
__name__  # 指标的键 test_metric{job="pushgateway"}  就是test_metric
job  target的job标签,为配置文件里的job_name值
action动作
- replace 默认 通过regex匹配source_labels标签的值,使用replacement来引用表达式匹配分组
relabel_configs:  # __address__=localhost:9090  => addr=localhost
    - action: replace
      source_labels: [ '__address__' ]
      regex: "(.*):(.*)"
      replacement: $1
      target_label:  'addr'
- keep 删除regex与连接不匹配的的目标source_labels
relabel_configs: # 只采集172.19.1.21机器指标
    - separator: ;
      source_labels: [ '__address__']
      regex: '172.19.1.21:.*'
      action: keep
- drop 删除与regex匹配的source_labels
relabel_configs: # 不采集172.19.1.21机器指标
    - action: drop
      source_labels: ['__address__']
     regex: '172.19.1.21:.*'
- labeldrop 删除与regex匹配的标签名称
- job_name: 'node_exporter'
    static_configs:
    - targets: ['172.19.1.21:9100','172.19.1.22:9100','172.19.1.23:9100']
      labels:
        env: 'test'
        zone: 'shanghai'
        label_name: 'Test_label'
        label_value: 'za'
        __host__: 'master_abc'
    relabel_configs:
    - regex: "label(.+)"
      action: labeldrop
- labelkeep 删除与regex不匹配的标签名称
- labelmap 匹配regex所有标签名称 然后复制匹配标签的值进行分组 replacement分组引用${1},${2}替换
- job_name: 'node_exporter'
    static_configs:
    - targets: ['172.19.1.21:9100','172.19.1.22:9100','172.19.1.23:9100']
      labels:
        env: 'test'
        zone: 'shanghai'
        label_name: 'Test_label'
        label_value: 'za'
        __host__: 'master_abc'
    relabel_configs:
    - source_labels: [ '__host___']
      regex: 'label_(.+)'
      replacement: $1
      action: labelmap
- labelmod 设置target_label 为modules连接的hash值source_labels
relabel_configs:
    - source_labels: [ '__address__']
      modulus: 8              # 根据当前Target实例__address__的值以8作为系数,
                                       # 这样每个Target实例都会包含一个新的标签_tmp_hash_value,
                                       # 并且该值的范围在1~10之间
      target_label: _tmp_bash_value
      action: hashmod

metric_relabel_configs

cpu使用率计算公式详解
(1-((sum(increase(node_cpu_seconds_total{mode="idle"}[2m])) by (instance)) /
(sum(increase(node_cpu_seconds_total[2m])) by (instance))))*100
prometheus命令行格式
标签过滤
count_netstat_wait_connections{exported_instance=~"web.*"}
# .* 正则表达式
# =~ 模糊匹配
# !~  模糊不匹配
数值过滤
count_netstat_wait_connections{exported_instance=~"web.*"} > 400
# 数值>400
rate函数
指定时间段,平均每秒的增量。针对Counter数据。
rate(node_network_receive_bytes_total{device="eth0"}[1m])
# 1min内,平均每秒的增量
increase函数
指定时间段的增量。针对Counter数据。
# 针对counter这种数值,increase() 截取一段时间的增量

increase(node_cpu_seconds_total{instance="10.1.24.87:9100"}[1m])  # 1m内的增量

cpu一般多核,计算也是计算多核总计使用率
# sum()  # 多核求和
sum(increase(node_cpu_seconds_total{instance="10.1.24.87:9100"}[1m]))

sum(increase(node_cpu_seconds_total{mode="idle"}[2m])) by (instance)/sum(increase(node_cpu_seconds_total[2m])) by (instance)
# by 分组求和
(1-((sum(increase(node_cpu_seconds_total{mode="idle"}[2m])) by (instance))/(sum(increase(node_cpu_seconds_total[2m])) by (instance))))*100
sum函数
求和。一般和by配合使用。
topk函数
取前几位最高值。
# counter类型
topk(3,count_netstat_wait_connections)

# gauge
topk(3,rate(node_network_receive_bytes[20m]))
count函数
数值符合条件的,数目加和。
count(count_netstat_wait_connections > 200) # tcp等待数>200的机器数量
pushgateway
采集数据被推送到pushgateway。
pushgateway的prometheus配置
# prometheus.yml

- job_name: 'pushgateway'

  static_configs:
    - targets: ['localhost:9091','localhost:9092']
脚本推送参数
echo "count_netstat_wait_connections 200" | curl --data-binary @- http://:9091$pushgatewayIP/metrics/job/$pushgateway1/instance/$hostname
案例
predict_linear函数
加速对未来一段时间的预测。
可以实时检测硬盘使用率的变化情况,假设在很小的时间段里发现硬盘使用率急速下降,那么对这种下降速度进行一个未来一段时间的预测,如果发现未来,比如5分钟内 按照这个速度,硬盘就肯定100%了,那么在硬盘还剩余20%,就会告警。
硬盘使用率
是read+write都会占用io。
((rate(node_disk_bytes_read[1m])+rate(node_disk_bytes_written[1m])) /1024/1024) > 0
# /1024/1024 => bytes => Mbs
ping延迟和丢包率
# 丢包率
timeout 5 ping -q -A -s 500 -W 1000 -c 100 192.168.1.1 | grep transmitted | awk '{print $6}'

# 延迟
timeout 5 ping -q -A -s 500 -W 1000 -c 100 192.168.1.1 | grep transmitted | awk '{print $10}'

-s 一个ping包的大小
-W 延迟timeout
-c 发送多少数据包


【推荐】国内首个AI IDE,深度理解中文开发场景,立即下载体验Trae
【推荐】编程新体验,更懂你的AI,立即体验豆包MarsCode编程助手
【推荐】抖音旗下AI助手豆包,你的智能百科全书,全免费不限次数
【推荐】轻量又高性能的 SSH 工具 IShell:AI 加持,快人一步
· 震惊!C++程序真的从main开始吗?99%的程序员都答错了
· 【硬核科普】Trae如何「偷看」你的代码?零基础破解AI编程运行原理
· 单元测试从入门到精通
· 上周热点回顾(3.3-3.9)
· winform 绘制太阳,地球,月球 运作规律