
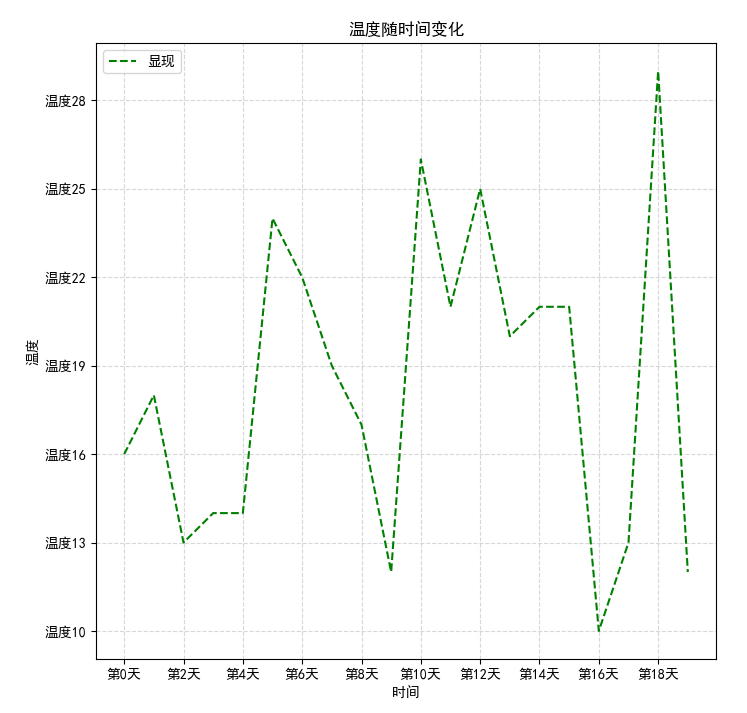
matplotlib图例不显示的坑
import matplotlib.pyplot as plt
import random
#创建画布
plt.figure(figsize=(8,8),dpi=100)
x=range(20)
y=[random.randint(10,30) for i in x]
#lines后面加个逗号
lines,=plt.plot(x, y,color='g',linestyle='dashed')
plt.grid(linestyle='--',alpha=0.5)
xlabel=['第{}天'.format(i) for i in x[::2]]
ylabel=['温度{}'.format(i) for i in range(10,30,3)]
plt.xticks(x[::2],xlabel)
plt.yticks(range(10,30,3),ylabel)
plt.legend([lines],['显现'],loc=1)
plt.title('温度随时间变化')
plt.xlabel('时间')
plt.ylabel('温度')
plt.show()

 浙公网安备 33010602011771号