3.29
在网页中生成具有交互功能的统计图(用到Serlvet/JSP)
基本步骤如下:
一、下载好JFreeChart所需要的jar包,下载地址:http://www.jfree.org/jfreechart/download.html
二、创建记录图书销售情况的数据库,在这里我用test表示我的数据库,表名为jfreechart_book,数据库脚本如下:
create table `test`.`jfreechart_book`(
`id` int unsigned not null auto_increment,
`book_name` varchar(45) default '' not null,
`book_count` int unsigned default '0' not null,
primary key (`id`)
);
create unique index `PRIMARY` on `test`.`jfreechart_book`(`id`);
三、用java 开发工具Eclilpse+MyEclipse IDE创建一个web project:JFreeChartDemo
四、将下载好所需要的包并解压,将解压好的jar包拷贝到上面创建好的工程的lib下
五、开始编码
(1)编写连接数据库的类DBConnection
(2)编写数据库表对应的java类Book
(3)编写操作数据库(这里只提供查询操作)dao类BookManagerDAO
(4)编写由JFreeChart这个组建构造统计图的类CreateChart
/**
* @author qpy_2006
*/
public class CreateChart {
/** 通过参数map对象从数据库中获取数据,用以创建一个DefaultPieDataset对象 */
public DefaultPieDataset getDataset(Map<Integer,Book> map)
{
DefaultPieDataset dataSet = new DefaultPieDataset();
Collection<Book> collection = map.values();
Iterator<Book> it = collection.iterator();
while(it.hasNext())
{
Book book = it.next();
dataSet.setValue(book.getBookName(), book.getBookCount());
}
return dataSet;
}
public JFreeChart getChart(DefaultPieDataset dataSet)
{
/* chart的标题可以自行定义,在这里就省略了 */
JFreeChart chart = ChartFactory.createPieChart("图书销售量统计图",dataSet,true,false,true);
/**
* 设置chart对象的各种属性
*/
// 设置图标标题,及字体
chart.setTitle(new TextTitle("图书销售统计图",new Font("黑体",Font.BOLD,22)));
//取得统计图表的第一个图例
LegendTitle legend = chart.getLegend(0);
//修改这个图例的字体
legend.setItemFont(new Font("宋体",Font.ITALIC,12));
//获得饼图的Plot对象
PiePlot plot = (PiePlot) chart.getPlot();
//设置饼图各部分的标签字体
plot.setLabelFont(new Font("楷体",Font.PLAIN,22));
//设置背景透明度(0-1.0之间)
plot.setBackgroundAlpha(0.9f);
//设置前景透明度(0-1.0之间)
plot.setForegroundAlpha(0.5f);
return chart;
}
}
(5)编写系统控制器Servlet类ChartServlet
/**
* @author qpy_2006
*/
public class ChartServlet extends HttpServlet {
private static final long serialVersionUID = 7292944149506099810L;
public ChartServlet() {
super();
}
public void destroy() {
super.destroy();
}
public void doGet(HttpServletRequest request, HttpServletResponse response)
throws ServletException, IOException {
this.doPost(request, response);
}
/**
* @author qpy_2006
*/
public void doPost(HttpServletRequest request, HttpServletResponse response)
throws ServletException, IOException {
response.setContentType("image/jpeg;charset=gbk");
/* 统计图标的标题可以由用户自己定义 */
OutputStream out = response.getOutputStream();
CreateChart createChart = new CreateChart();
Map<Integer,Book> map = new HashMap<Integer,Book>();
try {
map = BookManagerDAO.getAllBook();
} catch (ClassNotFoundException e) {
System.err.println("servlet doPost-->"+e.getMessage());
}
JFreeChart chart = createChart.getChart(createChart.getDataset(map));
ChartUtilities.writeChartAsJPEG(out, 1, chart, 780, 600, null);
out.close();
}
}
(6)在web.xml文件中配置第五步创建好的ChartServlet类
<servlet>
<display-name>ChartServlet</display-name>
<servlet-name>ChartServlet</servlet-name>
<servlet-class>org.qpy.servlet.ChartServlet</servlet-class>
</servlet>
<servlet-mapping>
<servlet-name>ChartServlet</servlet-name>
<url-pattern>/chart</url-pattern>
</servlet-mapping>
(7)创建一个用于向该ChartServlet发出请求的jsp页面
<%@ page language="java" pageEncoding="GBK"%>
<%
String path = request.getContextPath();
String basePath = request.getScheme()+"://"+request.getServerName()+":"+request.getServerPort()+path+"/";
%>
<!DOCTYPE HTML PUBLIC "-//W3C//DTD HTML 4.01 Transitional//EN">
<html>
<head>
<base href="<%=basePath%>">
<title>图书销售统计图</title>
<meta http-equiv="pragma" content="no-cache">
<meta http-equiv="cache-control" content="no-cache">
<meta http-equiv="expires" content="0">
<meta http-equiv="keywords" content="keyword1,keyword2,keyword3">
<meta http-equiv="description" content="This is my page">
</head>
<body>
<div><span><a href="<%=path %>/chart">查看图书销售统计图</a> </span></div>
</body>
</html>
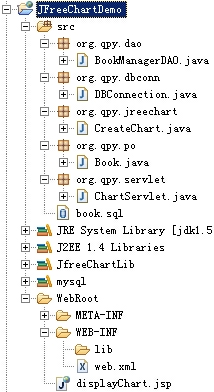
工程的目录结构如下图:
完成以上步骤后,就可以通过:http://localhost:8080/JFreeChartDemo/来访问已创建的Servlet的了。