微服务链路追踪-skywalking搭建
ElasticSearch搭建
不做赘述,参考上一份文章:https://www.cnblogs.com/1234cjq/p/15896987.html
下载并解压skywalking
wget https://archive.apache.org/dist/skywalking/8.5.0/apache-skywalking-apm-es7-8.5.0.tar.gz
tar -zxvf apache-skywalking-apm-es7-8.5.0.tar.gz
cd apache-skywalking-apm-bin-es7
SkyWalking OAP 搭建
修改 OAP 配置文件 config/application.ymlvim config/application.yml# 配置文件中默认选择的是H2数据源,切换成elasticsearch7,把elasticsearch7配置成自己安装的信息
# 重点修改 storage 配置项,通过 storage.selector 配置项来设置具体使用的存储器。
# storage.elasticsearch 配置项,设置使用 Elasticsearch6.X 版本作为存储器。
# 可以主要修改nameSpace、clusterNodes两个配置即可,设置使用的Elasticsearch的集群和命名空间。
# storage.elasticsearch7配置项,设置使用Elasticsearch7.X 版本作为存储器。
storage:
selector: ${SW_STORAGE:elasticsearch7}
附上application.yml配置文件: 9200端口的ip需要改成内网ip地址


# Licensed to the Apache Software Foundation (ASF) under one or more
# contributor license agreements.  See the NOTICE file distributed with
# this work for additional information regarding copyright ownership.
# The ASF licenses this file to You under the Apache License, Version 2.0
# (the "License"); you may not use this file except in compliance with
# the License.  You may obtain a copy of the License at
#
#     http://www.apache.org/licenses/LICENSE-2.0
#
# Unless required by applicable law or agreed to in writing, software
# distributed under the License is distributed on an "AS IS" BASIS,
# WITHOUT WARRANTIES OR CONDITIONS OF ANY KIND, either express or implied.
# See the License for the specific language governing permissions and
# limitations under the License.

cluster:
  selector: ${SW_CLUSTER:standalone}
  standalone:
  # Please check your ZooKeeper is 3.5+, However, it is also compatible with ZooKeeper 3.4.x. Replace the ZooKeeper 3.5+
  # library the oap-libs folder with your ZooKeeper 3.4.x library.
  zookeeper:
    nameSpace: ${SW_NAMESPACE:""}
    hostPort: ${SW_CLUSTER_ZK_HOST_PORT:localhost:2181}
    # Retry Policy
    baseSleepTimeMs: ${SW_CLUSTER_ZK_SLEEP_TIME:1000} # initial amount of time to wait between retries
    maxRetries: ${SW_CLUSTER_ZK_MAX_RETRIES:3} # max number of times to retry
    # Enable ACL
    enableACL: ${SW_ZK_ENABLE_ACL:false} # disable ACL in default
    schema: ${SW_ZK_SCHEMA:digest} # only support digest schema
    expression: ${SW_ZK_EXPRESSION:skywalking:skywalking}
  kubernetes:
    namespace: ${SW_CLUSTER_K8S_NAMESPACE:default}
    labelSelector: ${SW_CLUSTER_K8S_LABEL:app=collector,release=skywalking}
    uidEnvName: ${SW_CLUSTER_K8S_UID:SKYWALKING_COLLECTOR_UID}
  consul:
    serviceName: ${SW_SERVICE_NAME:"SkyWalking_OAP_Cluster"}
    # Consul cluster nodes, example: 10.0.0.1:8500,10.0.0.2:8500,10.0.0.3:8500
    hostPort: ${SW_CLUSTER_CONSUL_HOST_PORT:localhost:8500}
    aclToken: ${SW_CLUSTER_CONSUL_ACLTOKEN:""}
  etcd:
    serviceName: ${SW_SERVICE_NAME:"SkyWalking_OAP_Cluster"}
    # etcd cluster nodes, example: 10.0.0.1:2379,10.0.0.2:2379,10.0.0.3:2379
    hostPort: ${SW_CLUSTER_ETCD_HOST_PORT:localhost:2379}
  nacos:
    serviceName: ${SW_SERVICE_NAME:"SkyWalking_OAP_Cluster"}
    hostPort: ${SW_CLUSTER_NACOS_HOST_PORT:localhost:8848}
    # Nacos Configuration namespace
    namespace: ${SW_CLUSTER_NACOS_NAMESPACE:"public"}
    # Nacos auth username
    username: ${SW_CLUSTER_NACOS_USERNAME:""}
    password: ${SW_CLUSTER_NACOS_PASSWORD:""}
    # Nacos auth accessKey
    accessKey: ${SW_CLUSTER_NACOS_ACCESSKEY:""}
    secretKey: ${SW_CLUSTER_NACOS_SECRETKEY:""}
core:
  selector: ${SW_CORE:default}
  default:
    # Mixed: Receive agent data, Level 1 aggregate, Level 2 aggregate
    # Receiver: Receive agent data, Level 1 aggregate
    # Aggregator: Level 2 aggregate
    role: ${SW_CORE_ROLE:Mixed} # Mixed/Receiver/Aggregator
    restHost: ${SW_CORE_REST_HOST:0.0.0.0}
    restPort: ${SW_CORE_REST_PORT:12800}
    restContextPath: ${SW_CORE_REST_CONTEXT_PATH:/}
    restMinThreads: ${SW_CORE_REST_JETTY_MIN_THREADS:1}
    restMaxThreads: ${SW_CORE_REST_JETTY_MAX_THREADS:200}
    restIdleTimeOut: ${SW_CORE_REST_JETTY_IDLE_TIMEOUT:30000}
    restAcceptorPriorityDelta: ${SW_CORE_REST_JETTY_DELTA:0}
    restAcceptQueueSize: ${SW_CORE_REST_JETTY_QUEUE_SIZE:0}
    gRPCHost: ${SW_CORE_GRPC_HOST:0.0.0.0}
    gRPCPort: ${SW_CORE_GRPC_PORT:11800}
    maxConcurrentCallsPerConnection: ${SW_CORE_GRPC_MAX_CONCURRENT_CALL:0}
    maxMessageSize: ${SW_CORE_GRPC_MAX_MESSAGE_SIZE:0}
    gRPCThreadPoolQueueSize: ${SW_CORE_GRPC_POOL_QUEUE_SIZE:-1}
    gRPCThreadPoolSize: ${SW_CORE_GRPC_THREAD_POOL_SIZE:-1}
    gRPCSslEnabled: ${SW_CORE_GRPC_SSL_ENABLED:false}
    gRPCSslKeyPath: ${SW_CORE_GRPC_SSL_KEY_PATH:""}
    gRPCSslCertChainPath: ${SW_CORE_GRPC_SSL_CERT_CHAIN_PATH:""}
    gRPCSslTrustedCAPath: ${SW_CORE_GRPC_SSL_TRUSTED_CA_PATH:""}
    downsampling:
      - Hour
      - Day
    # Set a timeout on metrics data. After the timeout has expired, the metrics data will automatically be deleted.
    enableDataKeeperExecutor: ${SW_CORE_ENABLE_DATA_KEEPER_EXECUTOR:true} # Turn it off then automatically metrics data delete will be close.
    dataKeeperExecutePeriod: ${SW_CORE_DATA_KEEPER_EXECUTE_PERIOD:5} # How often the data keeper executor runs periodically, unit is minute
    recordDataTTL: ${SW_CORE_RECORD_DATA_TTL:3} # Unit is day
    metricsDataTTL: ${SW_CORE_METRICS_DATA_TTL:7} # Unit is day
    # Cache metrics data for 1 minute to reduce database queries, and if the OAP cluster changes within that minute,
    # the metrics may not be accurate within that minute.
    enableDatabaseSession: ${SW_CORE_ENABLE_DATABASE_SESSION:true}
    topNReportPeriod: ${SW_CORE_TOPN_REPORT_PERIOD:10} # top_n record worker report cycle, unit is minute
    # Extra model column are the column defined by in the codes, These columns of model are not required logically in aggregation or further query,
    # and it will cause more load for memory, network of OAP and storage.
    # But, being activated, user could see the name in the storage entities, which make users easier to use 3rd party tool, such as Kibana->ES, to query the data by themselves.
    activeExtraModelColumns: ${SW_CORE_ACTIVE_EXTRA_MODEL_COLUMNS:false}
    # The max length of service + instance names should be less than 200
    serviceNameMaxLength: ${SW_SERVICE_NAME_MAX_LENGTH:70}
    instanceNameMaxLength: ${SW_INSTANCE_NAME_MAX_LENGTH:70}
    # The max length of service + endpoint names should be less than 240
    endpointNameMaxLength: ${SW_ENDPOINT_NAME_MAX_LENGTH:150}
    # Define the set of span tag keys, which should be searchable through the GraphQL.
    searchableTracesTags: ${SW_SEARCHABLE_TAG_KEYS:http.method,status_code,db.type,db.instance,mq.queue,mq.topic,mq.broker}
    # Define the set of log tag keys, which should be searchable through the GraphQL.
    searchableLogsTags: ${SW_SEARCHABLE_LOGS_TAG_KEYS:level}
    # The number of threads used to synchronously refresh the metrics data to the storage.
    syncThreads: ${SW_CORE_SYNC_THREADS:2}
    # The maximum number of processes supported for each synchronous storage operation. When the number of the flush data is greater than this value, it will be assigned to multiple cores for execution.
    maxSyncOperationNum: ${SW_CORE_MAX_SYNC_OPERATION_NUM:50000}
storage:
  selector: ${SW_STORAGE:elasticsearch7}
  elasticsearch:
    nameSpace: ${SW_NAMESPACE:""}
    clusterNodes: ${SW_STORAGE_ES_CLUSTER_NODES:192.168.0.74:9200}
    protocol: ${SW_STORAGE_ES_HTTP_PROTOCOL:"http"}
    user: ${SW_ES_USER:""}
    password: ${SW_ES_PASSWORD:""}
    trustStorePath: ${SW_STORAGE_ES_SSL_JKS_PATH:""}
    trustStorePass: ${SW_STORAGE_ES_SSL_JKS_PASS:""}
    secretsManagementFile: ${SW_ES_SECRETS_MANAGEMENT_FILE:""} # Secrets management file in the properties format includes the username, password, which are managed by 3rd party tool.
    dayStep: ${SW_STORAGE_DAY_STEP:1} # Represent the number of days in the one minute/hour/day index.
    indexShardsNumber: ${SW_STORAGE_ES_INDEX_SHARDS_NUMBER:1} # Shard number of new indexes
    indexReplicasNumber: ${SW_STORAGE_ES_INDEX_REPLICAS_NUMBER:1} # Replicas number of new indexes
    # Super data set has been defined in the codes, such as trace segments.The following 3 config would be improve es performance when storage super size data in es.
    superDatasetDayStep: ${SW_SUPERDATASET_STORAGE_DAY_STEP:-1} # Represent the number of days in the super size dataset record index, the default value is the same as dayStep when the value is less than 0
    superDatasetIndexShardsFactor: ${SW_STORAGE_ES_SUPER_DATASET_INDEX_SHARDS_FACTOR:5} #  This factor provides more shards for the super data set, shards number = indexShardsNumber * superDatasetIndexShardsFactor. Also, this factor effects Zipkin and Jaeger traces.
    superDatasetIndexReplicasNumber: ${SW_STORAGE_ES_SUPER_DATASET_INDEX_REPLICAS_NUMBER:0} # Represent the replicas number in the super size dataset record index, the default value is 0.
    bulkActions: ${SW_STORAGE_ES_BULK_ACTIONS:1000} # Execute the async bulk record data every ${SW_STORAGE_ES_BULK_ACTIONS} requests
    flushInterval: ${SW_STORAGE_ES_FLUSH_INTERVAL:10} # flush the bulk every 10 seconds whatever the number of requests
    concurrentRequests: ${SW_STORAGE_ES_CONCURRENT_REQUESTS:2} # the number of concurrent requests
    resultWindowMaxSize: ${SW_STORAGE_ES_QUERY_MAX_WINDOW_SIZE:10000}
    metadataQueryMaxSize: ${SW_STORAGE_ES_QUERY_MAX_SIZE:5000}
    segmentQueryMaxSize: ${SW_STORAGE_ES_QUERY_SEGMENT_SIZE:200}
    profileTaskQueryMaxSize: ${SW_STORAGE_ES_QUERY_PROFILE_TASK_SIZE:200}
    oapAnalyzer: ${SW_STORAGE_ES_OAP_ANALYZER:"{\"analyzer\":{\"oap_analyzer\":{\"type\":\"stop\"}}}"} # the oap analyzer.
    oapLogAnalyzer: ${SW_STORAGE_ES_OAP_LOG_ANALYZER:"{\"analyzer\":{\"oap_log_analyzer\":{\"type\":\"standard\"}}}"} # the oap log analyzer. It could be customized by the ES analyzer configuration to support more language log formats, such as Chinese log, Japanese log and etc.
    advanced: ${SW_STORAGE_ES_ADVANCED:""}
  elasticsearch7:
    nameSpace: ${SW_NAMESPACE:""}
    clusterNodes: ${SW_STORAGE_ES_CLUSTER_NODES:192.168.0.74:9200}
    protocol: ${SW_STORAGE_ES_HTTP_PROTOCOL:"http"}
    trustStorePath: ${SW_STORAGE_ES_SSL_JKS_PATH:""}
    trustStorePass: ${SW_STORAGE_ES_SSL_JKS_PASS:""}
    dayStep: ${SW_STORAGE_DAY_STEP:1} # Represent the number of days in the one minute/hour/day index.
    indexShardsNumber: ${SW_STORAGE_ES_INDEX_SHARDS_NUMBER:1} # Shard number of new indexes
    indexReplicasNumber: ${SW_STORAGE_ES_INDEX_REPLICAS_NUMBER:1} # Replicas number of new indexes
    # Super data set has been defined in the codes, such as trace segments.The following 3 config would be improve es performance when storage super size data in es.
    superDatasetDayStep: ${SW_SUPERDATASET_STORAGE_DAY_STEP:-1} # Represent the number of days in the super size dataset record index, the default value is the same as dayStep when the value is less than 0
    superDatasetIndexShardsFactor: ${SW_STORAGE_ES_SUPER_DATASET_INDEX_SHARDS_FACTOR:5} #  This factor provides more shards for the super data set, shards number = indexShardsNumber * superDatasetIndexShardsFactor. Also, this factor effects Zipkin and Jaeger traces.
    superDatasetIndexReplicasNumber: ${SW_STORAGE_ES_SUPER_DATASET_INDEX_REPLICAS_NUMBER:0} # Represent the replicas number in the super size dataset record index, the default value is 0.
    user: ${SW_ES_USER:""}
    password: ${SW_ES_PASSWORD:""}
    secretsManagementFile: ${SW_ES_SECRETS_MANAGEMENT_FILE:""} # Secrets management file in the properties format includes the username, password, which are managed by 3rd party tool.
    bulkActions: ${SW_STORAGE_ES_BULK_ACTIONS:1000} # Execute the async bulk record data every ${SW_STORAGE_ES_BULK_ACTIONS} requests
    flushInterval: ${SW_STORAGE_ES_FLUSH_INTERVAL:10} # flush the bulk every 10 seconds whatever the number of requests
    concurrentRequests: ${SW_STORAGE_ES_CONCURRENT_REQUESTS:2} # the number of concurrent requests
    resultWindowMaxSize: ${SW_STORAGE_ES_QUERY_MAX_WINDOW_SIZE:10000}
    metadataQueryMaxSize: ${SW_STORAGE_ES_QUERY_MAX_SIZE:5000}
    segmentQueryMaxSize: ${SW_STORAGE_ES_QUERY_SEGMENT_SIZE:200}
    profileTaskQueryMaxSize: ${SW_STORAGE_ES_QUERY_PROFILE_TASK_SIZE:200}
    oapAnalyzer: ${SW_STORAGE_ES_OAP_ANALYZER:"{\"analyzer\":{\"oap_analyzer\":{\"type\":\"stop\"}}}"} # the oap analyzer.
    oapLogAnalyzer: ${SW_STORAGE_ES_OAP_LOG_ANALYZER:"{\"analyzer\":{\"oap_log_analyzer\":{\"type\":\"standard\"}}}"} # the oap log analyzer. It could be customized by the ES analyzer configuration to support more language log formats, such as Chinese log, Japanese log and etc.
    advanced: ${SW_STORAGE_ES_ADVANCED:""}
  h2:
    driver: ${SW_STORAGE_H2_DRIVER:org.h2.jdbcx.JdbcDataSource}
    url: ${SW_STORAGE_H2_URL:jdbc:h2:mem:skywalking-oap-db;DB_CLOSE_DELAY=-1}
    user: ${SW_STORAGE_H2_USER:sa}
    metadataQueryMaxSize: ${SW_STORAGE_H2_QUERY_MAX_SIZE:5000}
    maxSizeOfArrayColumn: ${SW_STORAGE_MAX_SIZE_OF_ARRAY_COLUMN:20}
    numOfSearchableValuesPerTag: ${SW_STORAGE_NUM_OF_SEARCHABLE_VALUES_PER_TAG:2}
  mysql:
    properties:
      jdbcUrl: ${SW_JDBC_URL:"jdbc:mysql://localhost:3306/swtest"}
      dataSource.user: ${SW_DATA_SOURCE_USER:root}
      dataSource.password: ${SW_DATA_SOURCE_PASSWORD:root@1234}
      dataSource.cachePrepStmts: ${SW_DATA_SOURCE_CACHE_PREP_STMTS:true}
      dataSource.prepStmtCacheSize: ${SW_DATA_SOURCE_PREP_STMT_CACHE_SQL_SIZE:250}
      dataSource.prepStmtCacheSqlLimit: ${SW_DATA_SOURCE_PREP_STMT_CACHE_SQL_LIMIT:2048}
      dataSource.useServerPrepStmts: ${SW_DATA_SOURCE_USE_SERVER_PREP_STMTS:true}
    metadataQueryMaxSize: ${SW_STORAGE_MYSQL_QUERY_MAX_SIZE:5000}
    maxSizeOfArrayColumn: ${SW_STORAGE_MAX_SIZE_OF_ARRAY_COLUMN:20}
    numOfSearchableValuesPerTag: ${SW_STORAGE_NUM_OF_SEARCHABLE_VALUES_PER_TAG:2}
  tidb:
    properties:
      jdbcUrl: ${SW_JDBC_URL:"jdbc:mysql://localhost:4000/tidbswtest"}
      dataSource.user: ${SW_DATA_SOURCE_USER:root}
      dataSource.password: ${SW_DATA_SOURCE_PASSWORD:""}
      dataSource.cachePrepStmts: ${SW_DATA_SOURCE_CACHE_PREP_STMTS:true}
      dataSource.prepStmtCacheSize: ${SW_DATA_SOURCE_PREP_STMT_CACHE_SQL_SIZE:250}
      dataSource.prepStmtCacheSqlLimit: ${SW_DATA_SOURCE_PREP_STMT_CACHE_SQL_LIMIT:2048}
      dataSource.useServerPrepStmts: ${SW_DATA_SOURCE_USE_SERVER_PREP_STMTS:true}
      dataSource.useAffectedRows: ${SW_DATA_SOURCE_USE_AFFECTED_ROWS:true}
    metadataQueryMaxSize: ${SW_STORAGE_MYSQL_QUERY_MAX_SIZE:5000}
    maxSizeOfArrayColumn: ${SW_STORAGE_MAX_SIZE_OF_ARRAY_COLUMN:20}
    numOfSearchableValuesPerTag: ${SW_STORAGE_NUM_OF_SEARCHABLE_VALUES_PER_TAG:2}
  influxdb:
    # InfluxDB configuration
    url: ${SW_STORAGE_INFLUXDB_URL:http://localhost:8086}
    user: ${SW_STORAGE_INFLUXDB_USER:root}
    password: ${SW_STORAGE_INFLUXDB_PASSWORD:}
    database: ${SW_STORAGE_INFLUXDB_DATABASE:skywalking}
    actions: ${SW_STORAGE_INFLUXDB_ACTIONS:1000} # the number of actions to collect
    duration: ${SW_STORAGE_INFLUXDB_DURATION:1000} # the time to wait at most (milliseconds)
    batchEnabled: ${SW_STORAGE_INFLUXDB_BATCH_ENABLED:true}
    fetchTaskLogMaxSize: ${SW_STORAGE_INFLUXDB_FETCH_TASK_LOG_MAX_SIZE:5000} # the max number of fetch task log in a request
    connectionResponseFormat: ${SW_STORAGE_INFLUXDB_CONNECTION_RESPONSE_FORMAT:MSGPACK} # the response format of connection to influxDB, cannot be anything but MSGPACK or JSON.
  postgresql:
    properties:
      jdbcUrl: ${SW_JDBC_URL:"jdbc:postgresql://localhost:5432/skywalking"}
      dataSource.user: ${SW_DATA_SOURCE_USER:postgres}
      dataSource.password: ${SW_DATA_SOURCE_PASSWORD:123456}
      dataSource.cachePrepStmts: ${SW_DATA_SOURCE_CACHE_PREP_STMTS:true}
      dataSource.prepStmtCacheSize: ${SW_DATA_SOURCE_PREP_STMT_CACHE_SQL_SIZE:250}
      dataSource.prepStmtCacheSqlLimit: ${SW_DATA_SOURCE_PREP_STMT_CACHE_SQL_LIMIT:2048}
      dataSource.useServerPrepStmts: ${SW_DATA_SOURCE_USE_SERVER_PREP_STMTS:true}
    metadataQueryMaxSize: ${SW_STORAGE_MYSQL_QUERY_MAX_SIZE:5000}
    maxSizeOfArrayColumn: ${SW_STORAGE_MAX_SIZE_OF_ARRAY_COLUMN:20}
    numOfSearchableValuesPerTag: ${SW_STORAGE_NUM_OF_SEARCHABLE_VALUES_PER_TAG:2}
  zipkin-elasticsearch7:
    nameSpace: ${SW_NAMESPACE:""}
    clusterNodes: ${SW_STORAGE_ES_CLUSTER_NODES:192.168.0.74:9200}
    protocol: ${SW_STORAGE_ES_HTTP_PROTOCOL:"http"}
    trustStorePath: ${SW_STORAGE_ES_SSL_JKS_PATH:""}
    trustStorePass: ${SW_STORAGE_ES_SSL_JKS_PASS:""}
    dayStep: ${SW_STORAGE_DAY_STEP:1} # Represent the number of days in the one minute/hour/day index.
    indexShardsNumber: ${SW_STORAGE_ES_INDEX_SHARDS_NUMBER:1} # Shard number of new indexes
    indexReplicasNumber: ${SW_STORAGE_ES_INDEX_REPLICAS_NUMBER:1} # Replicas number of new indexes
    # Super data set has been defined in the codes, such as trace segments.The following 3 config would be improve es performance when storage super size data in es.
    superDatasetDayStep: ${SW_SUPERDATASET_STORAGE_DAY_STEP:-1} # Represent the number of days in the super size dataset record index, the default value is the same as dayStep when the value is less than 0
    superDatasetIndexShardsFactor: ${SW_STORAGE_ES_SUPER_DATASET_INDEX_SHARDS_FACTOR:5} #  This factor provides more shards for the super data set, shards number = indexShardsNumber * superDatasetIndexShardsFactor. Also, this factor effects Zipkin and Jaeger traces.
    superDatasetIndexReplicasNumber: ${SW_STORAGE_ES_SUPER_DATASET_INDEX_REPLICAS_NUMBER:0} # Represent the replicas number in the super size dataset record index, the default value is 0.
    user: ${SW_ES_USER:""}
    password: ${SW_ES_PASSWORD:""}
    secretsManagementFile: ${SW_ES_SECRETS_MANAGEMENT_FILE:""} # Secrets management file in the properties format includes the username, password, which are managed by 3rd party tool.
    bulkActions: ${SW_STORAGE_ES_BULK_ACTIONS:1000} # Execute the async bulk record data every ${SW_STORAGE_ES_BULK_ACTIONS} requests
    syncBulkActions: ${SW_STORAGE_ES_SYNC_BULK_ACTIONS:50000} # Execute the sync bulk metrics data every ${SW_STORAGE_ES_SYNC_BULK_ACTIONS} requests
    flushInterval: ${SW_STORAGE_ES_FLUSH_INTERVAL:10} # flush the bulk every 10 seconds whatever the number of requests
    concurrentRequests: ${SW_STORAGE_ES_CONCURRENT_REQUESTS:2} # the number of concurrent requests
    resultWindowMaxSize: ${SW_STORAGE_ES_QUERY_MAX_WINDOW_SIZE:10000}
    metadataQueryMaxSize: ${SW_STORAGE_ES_QUERY_MAX_SIZE:5000}
    segmentQueryMaxSize: ${SW_STORAGE_ES_QUERY_SEGMENT_SIZE:200}
    profileTaskQueryMaxSize: ${SW_STORAGE_ES_QUERY_PROFILE_TASK_SIZE:200}
    oapAnalyzer: ${SW_STORAGE_ES_OAP_ANALYZER:"{\"analyzer\":{\"oap_analyzer\":{\"type\":\"stop\"}}}"} # the oap analyzer.
    oapLogAnalyzer: ${SW_STORAGE_ES_OAP_LOG_ANALYZER:"{\"analyzer\":{\"oap_log_analyzer\":{\"type\":\"standard\"}}}"} # the oap log analyzer. It could be customized by the ES analyzer configuration to support more language log formats, such as Chinese log, Japanese log and etc.
    advanced: ${SW_STORAGE_ES_ADVANCED:""}

agent-analyzer:
  selector: ${SW_AGENT_ANALYZER:default}
  default:
    sampleRate: ${SW_TRACE_SAMPLE_RATE:10000} # The sample rate precision is 1/10000. 10000 means 100% sample in default.
    slowDBAccessThreshold: ${SW_SLOW_DB_THRESHOLD:default:200,mongodb:100} # The slow database access thresholds. Unit ms.
    forceSampleErrorSegment: ${SW_FORCE_SAMPLE_ERROR_SEGMENT:true} # When sampling mechanism active, this config can open(true) force save some error segment. true is default.
    segmentStatusAnalysisStrategy: ${SW_SEGMENT_STATUS_ANALYSIS_STRATEGY:FROM_SPAN_STATUS} # Determine the final segment status from the status of spans. Available values are `FROM_SPAN_STATUS` , `FROM_ENTRY_SPAN` and `FROM_FIRST_SPAN`. `FROM_SPAN_STATUS` represents the segment status would be error if any span is in error status. `FROM_ENTRY_SPAN` means the segment status would be determined by the status of entry spans only. `FROM_FIRST_SPAN` means the segment status would be determined by the status of the first span only.
    # Nginx and Envoy agents can't get the real remote address.
    # Exit spans with the component in the list would not generate the client-side instance relation metrics.
    noUpstreamRealAddressAgents: ${SW_NO_UPSTREAM_REAL_ADDRESS:6000,9000}
    slowTraceSegmentThreshold: ${SW_SLOW_TRACE_SEGMENT_THRESHOLD:-1} # Setting this threshold about the latency would make the slow trace segments sampled if they cost more time, even the sampling mechanism activated. The default value is `-1`, which means would not sample slow traces. Unit, millisecond.
    meterAnalyzerActiveFiles: ${SW_METER_ANALYZER_ACTIVE_FILES:spring-sleuth} # Which files could be meter analyzed, files split by ","

log-analyzer:
  selector: ${SW_LOG_ANALYZER:default}
  default:
    lalFiles: ${SW_LOG_LAL_FILES:default}
    malFiles: ${SW_LOG_MAL_FILES:""}

event-analyzer:
  selector: ${SW_EVENT_ANALYZER:default}
  default:

receiver-sharing-server:
  selector: ${SW_RECEIVER_SHARING_SERVER:default}
  default:
    # For Jetty server
    restHost: ${SW_RECEIVER_SHARING_REST_HOST:0.0.0.0}
    restPort: ${SW_RECEIVER_SHARING_REST_PORT:0}
    restContextPath: ${SW_RECEIVER_SHARING_REST_CONTEXT_PATH:/}
    restMinThreads: ${SW_RECEIVER_SHARING_JETTY_MIN_THREADS:1}
    restMaxThreads: ${SW_RECEIVER_SHARING_JETTY_MAX_THREADS:200}
    restIdleTimeOut: ${SW_RECEIVER_SHARING_JETTY_IDLE_TIMEOUT:30000}
    restAcceptorPriorityDelta: ${SW_RECEIVER_SHARING_JETTY_DELTA:0}
    restAcceptQueueSize: ${SW_RECEIVER_SHARING_JETTY_QUEUE_SIZE:0}
    # For gRPC server
    gRPCHost: ${SW_RECEIVER_GRPC_HOST:0.0.0.0}
    gRPCPort: ${SW_RECEIVER_GRPC_PORT:0}
    maxConcurrentCallsPerConnection: ${SW_RECEIVER_GRPC_MAX_CONCURRENT_CALL:0}
    maxMessageSize: ${SW_RECEIVER_GRPC_MAX_MESSAGE_SIZE:0}
    gRPCThreadPoolQueueSize: ${SW_RECEIVER_GRPC_POOL_QUEUE_SIZE:0}
    gRPCThreadPoolSize: ${SW_RECEIVER_GRPC_THREAD_POOL_SIZE:0}
    gRPCSslEnabled: ${SW_RECEIVER_GRPC_SSL_ENABLED:false}
    gRPCSslKeyPath: ${SW_RECEIVER_GRPC_SSL_KEY_PATH:""}
    gRPCSslCertChainPath: ${SW_RECEIVER_GRPC_SSL_CERT_CHAIN_PATH:""}
    authentication: ${SW_AUTHENTICATION:""}
receiver-register:
  selector: ${SW_RECEIVER_REGISTER:default}
  default:

receiver-trace:
  selector: ${SW_RECEIVER_TRACE:default}
  default:

receiver-jvm:
  selector: ${SW_RECEIVER_JVM:default}
  default:

receiver-clr:
  selector: ${SW_RECEIVER_CLR:default}
  default:

receiver-profile:
  selector: ${SW_RECEIVER_PROFILE:default}
  default:

receiver-zabbix:
  selector: ${SW_RECEIVER_ZABBIX:-}
  default:
    port: ${SW_RECEIVER_ZABBIX_PORT:10051}
    host: ${SW_RECEIVER_ZABBIX_HOST:0.0.0.0}
    activeFiles: ${SW_RECEIVER_ZABBIX_ACTIVE_FILES:agent}

service-mesh:
  selector: ${SW_SERVICE_MESH:default}
  default:

envoy-metric:
  selector: ${SW_ENVOY_METRIC:default}
  default:
    acceptMetricsService: ${SW_ENVOY_METRIC_SERVICE:true}
    alsHTTPAnalysis: ${SW_ENVOY_METRIC_ALS_HTTP_ANALYSIS:""}
    # `k8sServiceNameRule` allows you to customize the service name in ALS via Kubernetes metadata,
    # the available variables are `pod`, `service`, f.e., you can use `${service.metadata.name}-${pod.metadata.labels.version}`
    # to append the version number to the service name.
    # Be careful, when using environment variables to pass this configuration, use single quotes(`''`) to avoid it being evaluated by the shell.
    k8sServiceNameRule: ${K8S_SERVICE_NAME_RULE:"${pod.metadata.labels.(service.istio.io/canonical-name)}"}

prometheus-fetcher:
  selector: ${SW_PROMETHEUS_FETCHER:-}
  default:
    enabledRules: ${SW_PROMETHEUS_FETCHER_ENABLED_RULES:"self"}

kafka-fetcher:
  selector: ${SW_KAFKA_FETCHER:-}
  default:
    bootstrapServers: ${SW_KAFKA_FETCHER_SERVERS:localhost:9092}
    partitions: ${SW_KAFKA_FETCHER_PARTITIONS:3}
    replicationFactor: ${SW_KAFKA_FETCHER_PARTITIONS_FACTOR:2}
    enableMeterSystem: ${SW_KAFKA_FETCHER_ENABLE_METER_SYSTEM:false}
    enableLog: ${SW_KAFKA_FETCHER_ENABLE_LOG:false}
    isSharding: ${SW_KAFKA_FETCHER_IS_SHARDING:false}
    consumePartitions: ${SW_KAFKA_FETCHER_CONSUME_PARTITIONS:""}
    kafkaHandlerThreadPoolSize: ${SW_KAFKA_HANDLER_THREAD_POOL_SIZE:-1}
    kafkaHandlerThreadPoolQueueSize: ${SW_KAFKA_HANDLER_THREAD_POOL_QUEUE_SIZE:-1}

receiver-meter:
  selector: ${SW_RECEIVER_METER:default}
  default:

receiver-otel:
  selector: ${SW_OTEL_RECEIVER:-}
  default:
    enabledHandlers: ${SW_OTEL_RECEIVER_ENABLED_HANDLERS:"oc"}
    enabledOcRules: ${SW_OTEL_RECEIVER_ENABLED_OC_RULES:"istio-controlplane"}

receiver_zipkin:
  selector: ${SW_RECEIVER_ZIPKIN:-}
  default:
    host: ${SW_RECEIVER_ZIPKIN_HOST:0.0.0.0}
    port: ${SW_RECEIVER_ZIPKIN_PORT:9411}
    contextPath: ${SW_RECEIVER_ZIPKIN_CONTEXT_PATH:/}
    jettyMinThreads: ${SW_RECEIVER_ZIPKIN_JETTY_MIN_THREADS:1}
    jettyMaxThreads: ${SW_RECEIVER_ZIPKIN_JETTY_MAX_THREADS:200}
    jettyIdleTimeOut: ${SW_RECEIVER_ZIPKIN_JETTY_IDLE_TIMEOUT:30000}
    jettyAcceptorPriorityDelta: ${SW_RECEIVER_ZIPKIN_JETTY_DELTA:0}
    jettyAcceptQueueSize: ${SW_RECEIVER_ZIPKIN_QUEUE_SIZE:0}

receiver_jaeger:
  selector: ${SW_RECEIVER_JAEGER:-}
  default:
    gRPCHost: ${SW_RECEIVER_JAEGER_HOST:0.0.0.0}
    gRPCPort: ${SW_RECEIVER_JAEGER_PORT:14250}

receiver-browser:
  selector: ${SW_RECEIVER_BROWSER:default}
  default:
    # The sample rate precision is 1/10000. 10000 means 100% sample in default.
    sampleRate: ${SW_RECEIVER_BROWSER_SAMPLE_RATE:10000}

receiver-log:
  selector: ${SW_RECEIVER_LOG:default}
  default:

query:
  selector: ${SW_QUERY:graphql}
  graphql:
    path: ${SW_QUERY_GRAPHQL_PATH:/graphql}

alarm:
  selector: ${SW_ALARM:default}
  default:

telemetry:
  selector: ${SW_TELEMETRY:none}
  none:
  prometheus:
    host: ${SW_TELEMETRY_PROMETHEUS_HOST:0.0.0.0}
    port: ${SW_TELEMETRY_PROMETHEUS_PORT:1234}
    sslEnabled: ${SW_TELEMETRY_PROMETHEUS_SSL_ENABLED:false}
    sslKeyPath: ${SW_TELEMETRY_PROMETHEUS_SSL_KEY_PATH:""}
    sslCertChainPath: ${SW_TELEMETRY_PROMETHEUS_SSL_CERT_CHAIN_PATH:""}

configuration:
  selector: ${SW_CONFIGURATION:none}
  none:
  grpc:
    host: ${SW_DCS_SERVER_HOST:""}
    port: ${SW_DCS_SERVER_PORT:80}
    clusterName: ${SW_DCS_CLUSTER_NAME:SkyWalking}
    period: ${SW_DCS_PERIOD:20}
  apollo:
    apolloMeta: ${SW_CONFIG_APOLLO:http://localhost:8080}
    apolloCluster: ${SW_CONFIG_APOLLO_CLUSTER:default}
    apolloEnv: ${SW_CONFIG_APOLLO_ENV:""}
    appId: ${SW_CONFIG_APOLLO_APP_ID:skywalking}
    period: ${SW_CONFIG_APOLLO_PERIOD:5}
  zookeeper:
    period: ${SW_CONFIG_ZK_PERIOD:60} # Unit seconds, sync period. Default fetch every 60 seconds.
    nameSpace: ${SW_CONFIG_ZK_NAMESPACE:/default}
    hostPort: ${SW_CONFIG_ZK_HOST_PORT:localhost:2181}
    # Retry Policy
    baseSleepTimeMs: ${SW_CONFIG_ZK_BASE_SLEEP_TIME_MS:1000} # initial amount of time to wait between retries
    maxRetries: ${SW_CONFIG_ZK_MAX_RETRIES:3} # max number of times to retry
  etcd:
    period: ${SW_CONFIG_ETCD_PERIOD:60} # Unit seconds, sync period. Default fetch every 60 seconds.
    group: ${SW_CONFIG_ETCD_GROUP:skywalking}
    serverAddr: ${SW_CONFIG_ETCD_SERVER_ADDR:localhost:2379}
    clusterName: ${SW_CONFIG_ETCD_CLUSTER_NAME:default}
  consul:
    # Consul host and ports, separated by comma, e.g. 1.2.3.4:8500,2.3.4.5:8500
    hostAndPorts: ${SW_CONFIG_CONSUL_HOST_AND_PORTS:1.2.3.4:8500}
    # Sync period in seconds. Defaults to 60 seconds.
    period: ${SW_CONFIG_CONSUL_PERIOD:60}
    # Consul aclToken
    aclToken: ${SW_CONFIG_CONSUL_ACL_TOKEN:""}
  k8s-configmap:
    period: ${SW_CONFIG_CONFIGMAP_PERIOD:60}
    namespace: ${SW_CLUSTER_K8S_NAMESPACE:default}
    labelSelector: ${SW_CLUSTER_K8S_LABEL:app=collector,release=skywalking}
  nacos:
    # Nacos Server Host
    serverAddr: ${SW_CONFIG_NACOS_SERVER_ADDR:127.0.0.1}
    # Nacos Server Port
    port: ${SW_CONFIG_NACOS_SERVER_PORT:8848}
    # Nacos Configuration Group
    group: ${SW_CONFIG_NACOS_SERVER_GROUP:skywalking}
    # Nacos Configuration namespace
    namespace: ${SW_CONFIG_NACOS_SERVER_NAMESPACE:}
    # Unit seconds, sync period. Default fetch every 60 seconds.
    period: ${SW_CONFIG_NACOS_PERIOD:60}
    # Nacos auth username
    username: ${SW_CONFIG_NACOS_USERNAME:""}
    password: ${SW_CONFIG_NACOS_PASSWORD:""}
    # Nacos auth accessKey
    accessKey: ${SW_CONFIG_NACOS_ACCESSKEY:""}
    secretKey: ${SW_CONFIG_NACOS_SECRETKEY:""}

exporter:
  selector: ${SW_EXPORTER:-}
  grpc:
    targetHost: ${SW_EXPORTER_GRPC_HOST:127.0.0.1}
    targetPort: ${SW_EXPORTER_GRPC_PORT:9870}

health-checker:
  selector: ${SW_HEALTH_CHECKER:-}
  default:
    checkIntervalSeconds: ${SW_HEALTH_CHECKER_INTERVAL_SECONDS:5}

configuration-discovery:
  selector: ${SW_CONFIGURATION_DISCOVERY:default}
  default:
    disableMessageDigest: ${SW_DISABLE_MESSAGE_DIGEST:false}

receiver-event:
  selector: ${SW_RECEIVER_EVENT:default}
  default:
启动OAP ,oap默认端口为11800
$ bin/oapService.sh
SkyWalking OAP started successfully!查看日志
tail -f logs/skywalking-oap-server.log
#停用oap
 ps -ef|grep oap
kill -9 123630
SkyWalking UI 搭建
由于SkyWalking UI的默认地址是8080,与很多中间件有冲突,可以修改一下
vi webapp/webapp.yml
# 修改webapp/webapp.yml
server:
  port: 18080
启动 SkyWalking UI 服务
$ bin/webappService.sh
SkyWalking Web Application started successfully!
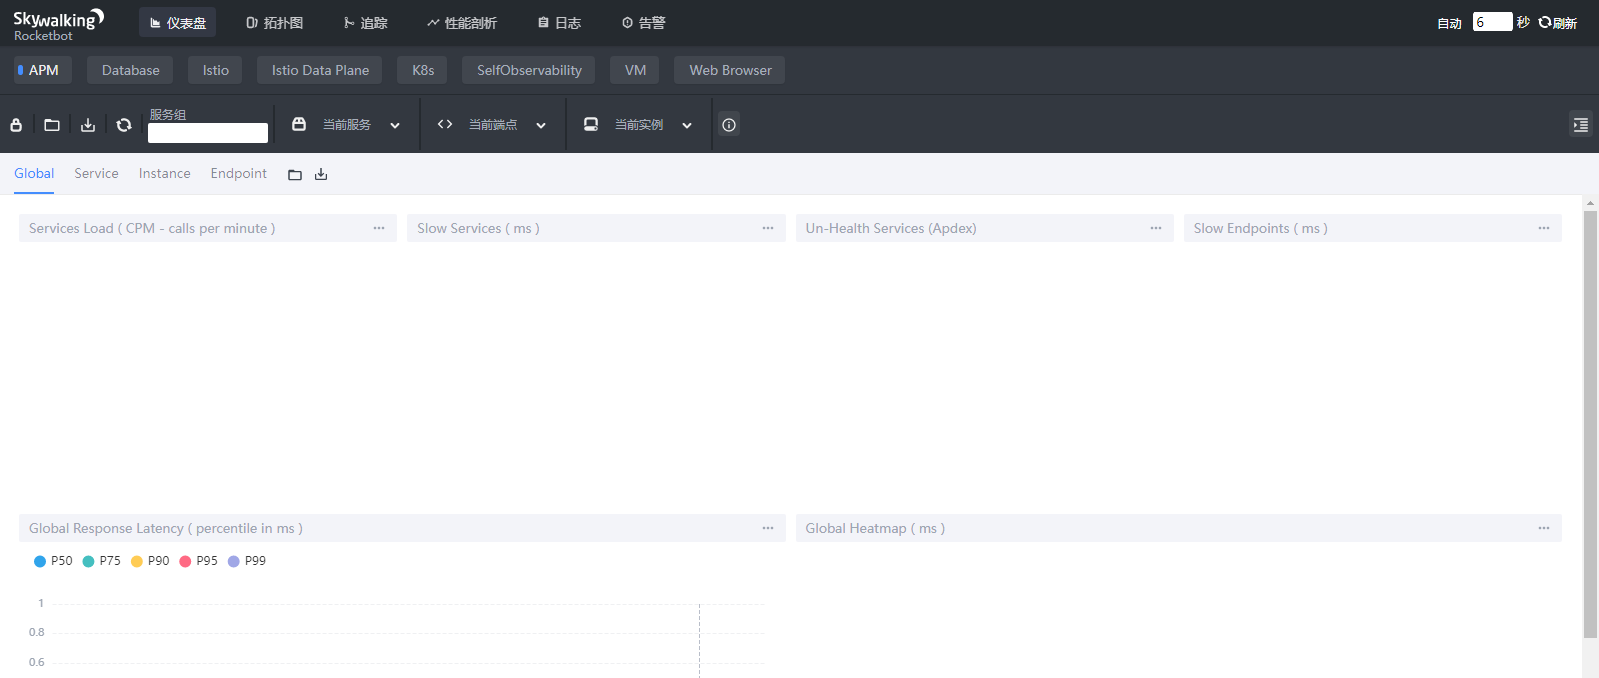
网址输入http://122.9.177.68:18080/ 进入控制台页面
skywalking-agent部署
修改探针默认配置 agent/config/agent.config
collector.backend_service=${SW_AGENT_COLLECTOR_BACKEND_SERVICES:122.9.177.68:11800}
agent.sample_n_per_3_secs=${SW_AGENT_SAMPLE:1}


agent.sample_n_per_3_secs配置说明:
在访问量较少时,链路全量收集不会对系统带来太大负担,能够完整的观测到系统的运行状况。但是在访问量较大时,全量的链路收集,对链路收集的客户端(agent探针)、服务端(SkyWalking OAP)、存储器(例如说 Elastcsearch)都会带来较大的性能开销,甚至会影响应用的正常运行。在访问量级较大的情况下,往往会选择抽样采样,只收集部分链路信息。SkyWalking Agent 在 agent/config/agent.config 配置文件中,定义了 agent.sample_n_per_3_secs 配置项,设置每 3 秒可收集的链路数据的数量。
我们需要将 agent 目录,拷贝到 Java 应用所在的服务器上。这样,Java 应用才可以配置使用该 SkyWalking Agent。通过设置启动参数的方式检测系统,没有代码侵入。
将/opt/skyWalking/apache-skywalking-apm-bin-es7下的整个agent文件夹复制到应用服务器上
#在服务的启动命令中添加参数javaagent、Dskywalking.agent.service_name
nohup java -Xms1024m -Xmx1024m -XX:+HeapDumpOnOutOfMemoryError -XX:HeapDumpPath=/opt/apphome/msdp-2.0/msdp-wk-biz.hprof -server  -javaagent:/opt/apphome/agent/skywalking-agent.jar -Dskywalking.agent.service_name=msdp-wk -jar msdp-wk-biz.jar > msdp-wk-biz.log --logging.level.com.iyysoft.cloud.msdp.wk=ERROR &
Idea 配置,如果我们是本地启动的项目,开发工具使用的IDEA,我们只需要在如下图所示地方配置启动附加信息即可
    # javaagent配置的是agent对应的jar位置。
    # Dskywalking.agent.service_name配置建议使用服务的spring.application.name方便区分。
    -javaagent:D:\Develop\apache-skywalking-apm-bin-es7\agent\skywalking-agent.jar
    -Dskywalking.agent.service_name=msdp-wk
参考文献:
https://blog.csdn.net/zhangcongyi420/article/details/109701518
https://www.jianshu.com/p/270c3ce58e4c
https://www.jianshu.com/p/d16732c295f7
