第二章
2.1
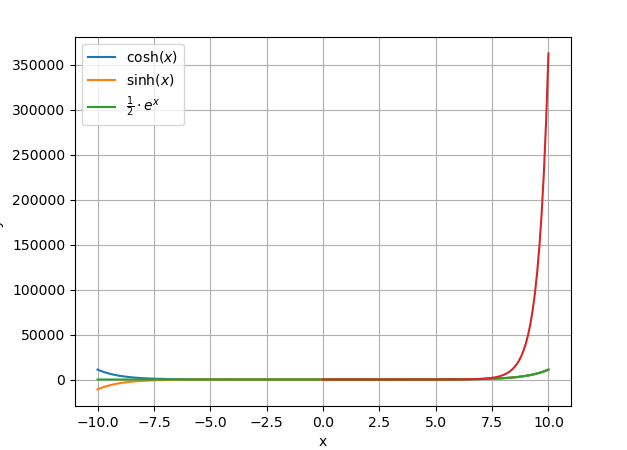
import math
import pylab as plt
import numpy as np
x = np.linspace(-10, 10, 100)
y1 = np.cosh(x)
y2 = np.sinh(x)
y3 = math.e**x/2
plt.plot(x, y1, label='$\mathrm{cosh}(x)$')
plt.plot(x, y2, label='$\mathrm{sinh}(x)$')
plt.plot(x, y3, label='$\frac{1}{2} \cdot e^x$')
plt.legend()
plt.xlabel('$x$')
plt.ylabel('$y$')
print("3023")
结果

2.2
import numpy as np
import matplotlib.pyplot as plt
from scipy.integrate import quad
def fun(t, x):
return np.exp(-t) * (t ** (x - 1))
x = np.linspace(0, 10, 100)
y = [quad(fun, 0, np.inf, args=i)[0] for i in x] # 计算积分
plt.plot(x, y)
plt.xlabel('x')
plt.ylabel('$y$')
plt.grid(True)
plt.show()
print("3023")
结果
2.3
import numpy as np
import matplotlib.pyplot as plt
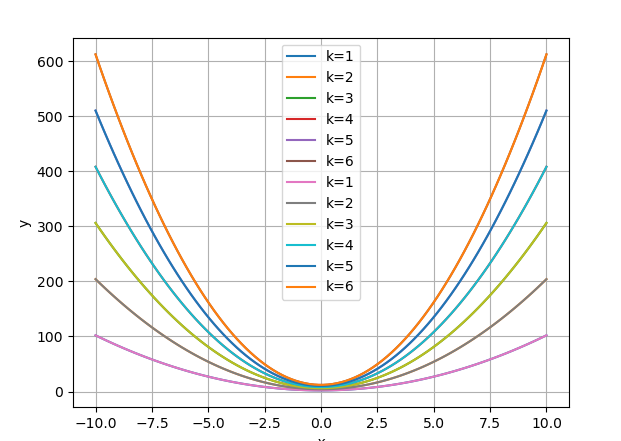
k_values = [1, 2, 3, 4, 5, 6]
x = np.linspace(-10, 10, 100)
for k in k_values:
y = k * x ** 2 + 2 * k
label = f'k={k}'
plt.plot(x, y, label=label)
plt.xlabel('$x$')
plt.ylabel('y')
plt.legend()
plt.grid(True)
plt.show()
print("3023")
结果
2.4
import numpy as np
import matplotlib.pyplot as plt
plt.rc('font', family='SimHei')
plt.rc('axes', unicode_minus=False)
k_values = [1, 2, 3, 4, 5, 6]
x = np.linspace(-10, 10, 100)
fig, axs = plt.subplots(2, 3, figsize=(10, 6))
for i, k in enumerate(k_values):
y = k * x ** 2 + 2 * k
row = i // 3
col = i % 3
ax = axs[row, col]
label = f'k={k}'
ax.plot(x, y, label=label)
ax.set_xlabel('x')
ax.set_ylabel('y')
ax.set_title(f'图 {i+1}')
ax.legend()
ax.grid(True)
plt.tight_layout()
plt.show()
print("3023")
结果

2.5
a = 2
b = np.sqrt(10)
c = np.sqrt(8)
phi = np.arange(0, 2*np.pi+0.1, 0.1)
theta = np.arange(-1, 1.1, 0.1)[:, np.newaxis]
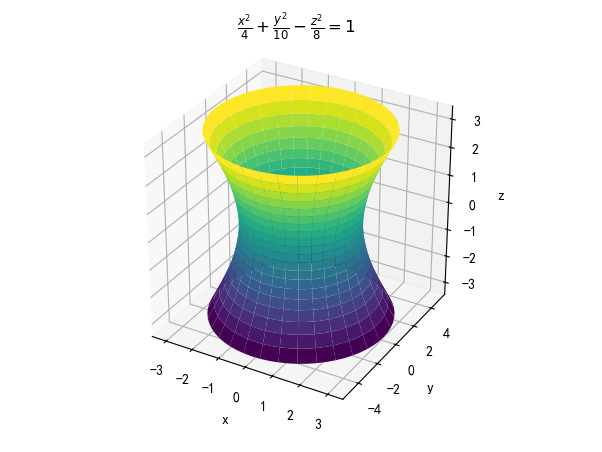
x = a * np.cosh(theta) * np.cos(phi)
y = b * np.cosh(theta) * np.sin(phi)
z = c * np.sinh(theta)
fig = plt.figure()
ax = fig.add_subplot(projection='3d')
ax.plot_surface(x, y, z, cmap='viridis')
ax.set_xlabel('x')
ax.set_ylabel('y')
ax.set_zlabel('z')
ax.set_box_aspect([1, 1, 1])
ax.set_title('$\frac{x2}{4}+\frac{y2}{10}-\frac{z^2}{8}=1$')
plt.show()
print("3023")
结果
2.6
import pandas as pd
import numpy as np
import matplotlib.pyplot as plt
from scipy.interpolate import RectBivariateSpline
x = np.arange(0, 101, 1)
y = np.arange(0, 101, 1)
z = np.random.randint(0, 1001, size=(101, 101))
df = pd.DataFrame(data=z, index=x, columns=y)
df.to_excel('data.xlsx')
df = pd.read_excel('data.xlsx', header=None)
x = df.iloc[1:, 0].values
y = df.iloc[0, 1:].values
z = df.iloc[1:, 1:].values
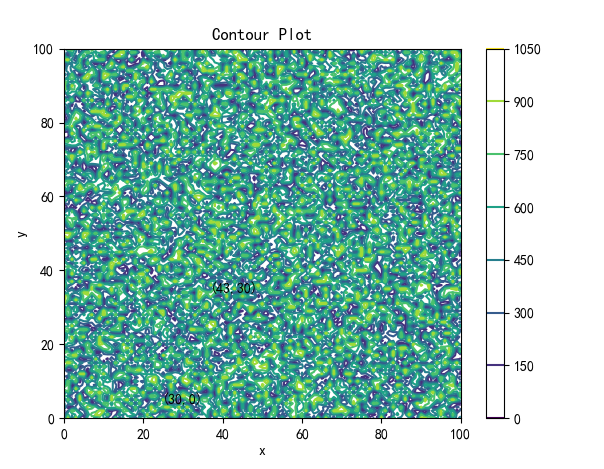
plt.contour(x, y, z)
plt.xlabel('x')
plt.ylabel('y')
plt.title('Contour Plot')
plt.colorbar()
point1 = (30, 0)
point2 = (43, 30)
plt.annotate('(30,0)', point1, textcoords="offset points", xytext=(0,10), ha='center')
plt.annotate('(43,30)', point2, textcoords="offset points", xytext=(0,10), ha='center')
interp_func = RectBivariateSpline(x, y, z)
x_min, x_max = min(x), max(x)
y_min, y_max = min(y), max(y)
grid_size = 100
x_grid = np.linspace(x_min, x_max, grid_size)
y_grid = np.linspace(y_min, y_max, grid_size)
z_grid = interp_func(x_grid, y_grid)
area = np.trapz(np.trapz(z_grid, x_grid), y_grid)
print('区域面积:', area)
plt.show()
print("3023")
结果
import pandas as pd
import matplotlib.pyplot as plt
import numpy as np
df = pd.read_excel('data.xlsx', header=None)
x = df.iloc[1:, 0].values
y = df.iloc[0, 1:].values
z = df.iloc[1:, 1:].values
X, Y = np.meshgrid(y, x)
fig = plt.figure()
ax = fig.add_subplot(111, projection='3d')
ax.plot_surface(X, Y, z)
ax.set_xlabel('Y')
ax.set_ylabel('X')
ax.set_zlabel('Z')
plt.show()
print("3023")
结果
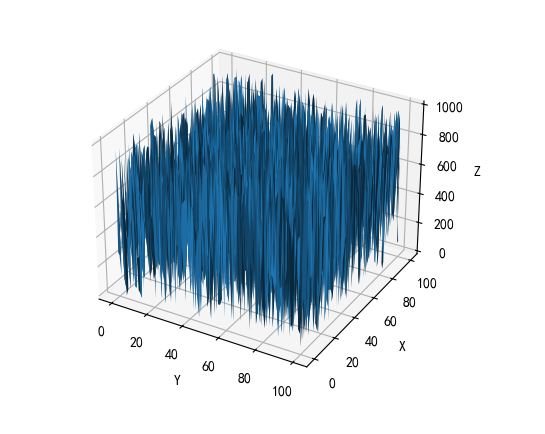
2.7
import numpy as np
A = np.array([[4, 2, -1], [3, -1, 2], [11, 3, 0]])
b = np.array([2, 10, 8])
x = np.linalg.lstsq(A, b)
if np.linalg.matrix_rank(A) == np.linalg.matrix_rank(np.column_stack((A, b))):
if np.linalg.matrix_rank(A) == A.shape[1]:
print("线性方程组有唯一解")
x_unique = np.linalg.solve(A, b)
print("唯一解 x =", x_unique)
else:
print("线性方程组有无穷多解")
x_least_squares = np.linalg.lstsq(A, b, rcond=None)[0]
print("最小二乘解 x =", x_least_squares)
else:
print("线性方程组无解")
x_least_squares = np.linalg.lstsq(A, b, rcond=None)[0]
print("最小二乘解 x =", x_least_squares)
x_min_norm = np.linalg.pinv(A).dot(b)
print("最小范数解 x =", x_min_norm)
结果
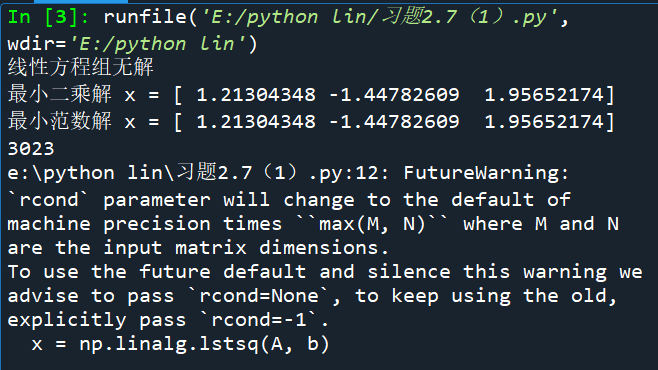
import numpy as np
A = np.array([[2, 3, 1], [1, -2, 4], [3, 8, -2],[4,-1,9]])
b = np.array([4, -5, 13,-6])
x = np.linalg.lstsq(A, b)
if np.linalg.matrix_rank(A) == np.linalg.matrix_rank(np.column_stack((A, b))):
if np.linalg.matrix_rank(A) == A.shape[1]:
print("线性方程组有唯一解")
x_unique = np.linalg.solve(A, b)
print("唯一解 x =", x_unique)
else:
print("线性方程组有无穷多解")
x_least_squares = np.linalg.lstsq(A, b, rcond=None)[0]
print("最小二乘解 x =", x_least_squares)
else:
print("线性方程组无解")
x_least_squares = np.linalg.lstsq(A, b, rcond=None)[0]
print("最小二乘解 x =", x_least_squares)
x_min_norm = np.linalg.pinv(A).dot(b)
print("最小范数解 x =", x_min_norm)
print("3023")
结果

2.8
import numpy as np
A = np.zeros((1000, 1000))
np.fill_diagonal(A, 4)
np.fill_diagonal(A[:, 1:], 1)
np.fill_diagonal(A[1:, :], 1)
b = np.arange(1, 1001)
if np.linalg.matrix_rank(A) == np.linalg.matrix_rank(np.column_stack((A, b))):
if np.linalg.matrix_rank(A) == A.shape[1]:
print("线性方程组有唯一解")
x_unique = np.linalg.solve(A, b)
print("唯一解 x =", x_unique)
else:
print("线性方程组有无穷多解")
x_least_squares = np.linalg.lstsq(A, b, rcond=None)[0]
print("最小二乘解 x =", x_least_squares)
else:
print("线性方程组无解")
x_least_squares = np.linalg.lstsq(A, b, rcond=None)[0]
print("最小二乘解 x =", x_least_squares)
x_min_norm = np.linalg.pinv(A).dot(b)
print("最小范数解 x =", x_min_norm)
print("3023")
结果
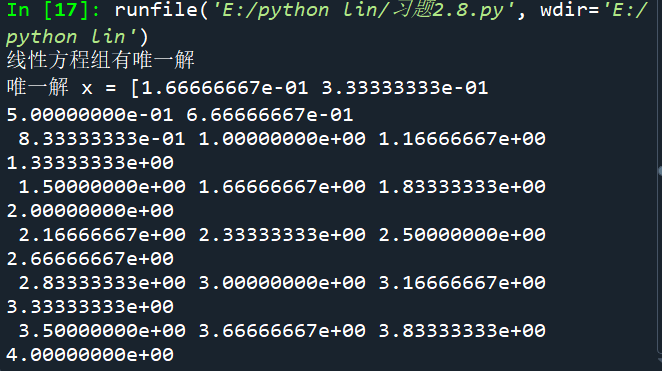

2.9
from sympy import symbols, Eq, solve
x, y = symbols('x y')
equations = (Eq(x**2 - y - x - 3, 0), Eq(x + 3*y - 2, 0))
symbolic_solution = solve(equations, (x, y))
print("符号解:", symbolic_solution)
from scipy.optimize import fsolve
def equations(variables):
x, y = variables
return [x**2 - y - x - 3, x + 3*y - 2]
initial_guess = [1, 1]
numeric_solution = fsolve(equations, initial_guess)
print("数值解:", numeric_solution)
print("3023")
结果

2.10
from sympy import symbols, pi, integrate, sqrt
y = symbols('y')
curve1 = y - sqrt(4*y - y**2)
curve2 = sqrt(4 - y)
volume = pi * integrate((curve12 - curve22), (y, 1, 3))
print("容器的体积:", volume)
g = 9.8
p = 1000
work = p * g * volume
print("至少需要做多少功:", work)
结果

2。11
import numpy as np
from scipy.optimize import fsolve
def f(x):
return (abs(x + 1) - abs(x - 1)) / 2 + np.sin(x)
def g(x):
return (abs(x + 3) - abs(x - 3)) / 2 + np.cos(x)
def equations(variables):
x1, x2, y1, y2 = variables[:4]
eq1 = 2 * x1 - (3 * f(y1) + 4 * g(y2) - 1)
eq2 = 3 * x2 - (2 * f(y1) + 6 * g(y2) - 2)
eq3 = y1 - (f(x1) + 3 * g(x2) - 3)
eq4 = 5 * y2 - (4 * f(x1) + 6 * g(x2) - 1)
return [eq1, eq2, eq3, eq4]
initial_guess = [0, 0, 0, 0]
numeric_solution = fsolve(equations, initial_guess)
print("数值解:", numeric_solution)
print("3023")
结果

2.12
import numpy as np
matrix = np.array([[-1, 1, 0], [-4, 3, 0], [1, 0, 2]])
eigenvalues, eigenvectors = np.linalg.eig(matrix)
print("特征值:", eigenvalues)
print("特征向量:\n", eigenvectors)
symbolic_eigenvalues = np.linalg.eigvals(matrix)
symbolic_eigenvectors = np.linalg.eig(matrix)[1]
print("特征值的符号解:", symbolic_eigenvalues)
print("特征向量的符号解:\n", symbolic_eigenvectors)
print("3023")
结果

2.13
import numpy as np
from scipy.optimize import least_squares
def f(x):
return (np.abs(x + 1) - np.abs(x - 1)) / 2 + np.sin(x)
def g(x):
return (np.abs(x + 3) - np.abs(x - 3)) / 2 + np.cos(x)
def equations(variables):
x1, x2, y1, y2 = variables[:4]
eq1 = 2 * x1 - (3 * f(y1) + 4 * g(y2) - 1)
eq2 = 3 * x2 - (2 * f(y1) + 6 * g(y2) - 2)
eq3 = y1 - (f(x1) + 3 * g(x2) - 3)
eq4 = 5 * y2 - (4 * f(x1) + 6 * g(x2) - 1)
eq5 = x1 + y1 - (f(y2) + g(x2) - 2)
eq6 = x2 - 3 * y2 - (2 * f(x1) - 10 * g(y1) - 5)
return [eq1, eq2, eq3, eq4, eq5, eq6]
initial_guess = [0, 0, 0, 0]
result = least_squares(equations, initial_guess)
numeric_solution = result.x
print("最小二乘解:", numeric_solution)
print("3023")
结果


