OpenCV Python – 如何计算和绘制图像区域直方图?
在OpenCV中,我们使用cv2.calcHist()函数来计算图像的直方图。我们可以使用此函数来计算图像区域直方图。要计算图像中某个区域的直方图,我们首先定义一个掩码。遮罩中的白色用于在原始输入图像中检查的区域,遮罩图像中的黑色用于忽略区域。现在我们计算将此掩码作为参数传递给函数的直方图。
步骤
要计算和绘制图像区域区域的直方图,可以按照以下步骤操作 -
-
导入所需的库 OpenCV、NumPy 和 matplotlib。确保您已经安装了它们。
-
使用 cv2.imread() 方法读取输入图像。指定映像的完整路径。
-
为我们的图像定义一个蒙版。遮罩图像中的黑色表示要忽略的区域,白色表示要检查原始输入图像中的区域。
-
使用 cv2.split() 函数拆分输入图像的不同通道(蓝色、绿色和红色)。
-
使用上述定义的掩码计算输入图像不同通道的直方图。绘制输入图像不同颜色的直方图。
hist = cv2.calcHist([channel], [0], mask, [256], [0, 256])
-
要可视化输入图像的遮罩区域,请使用遮罩图像对输入图像执行cv2.bitwise_and()操作。它创建输入图像的遮罩区域。
让我们看一些例子,以便清楚地理解这个问题。
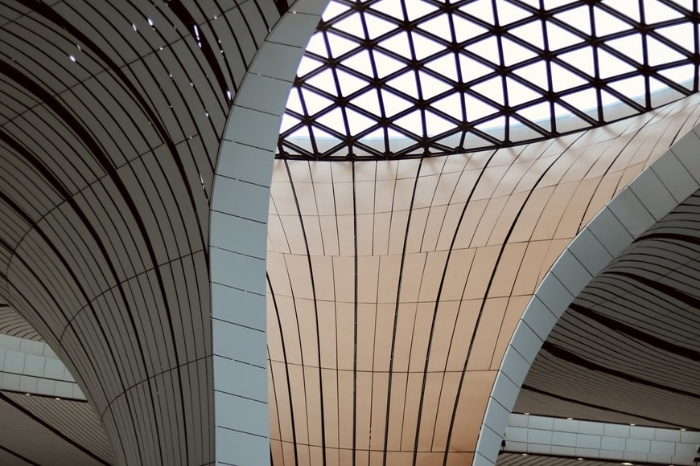
输入
在下面的示例中,我们使用下图作为输入文件。
例
在此示例中,我们计算输入图像矩形区域的直方图并绘制直方图。
# import required libraries import cv2 from matplotlib import pyplot as plt import numpy as np # Read the input image img = cv2.imread('architecture2.jpg') # define a function to compute and plot histogram def plot_histogram(img, title, mask=None): # split the image into blue, green and red channels channels = cv2.split(img) colors = ("b", "g", "r") plt.title(title) plt.xlabel("Bins") plt.ylabel("# of Pixels") # loop over the image channels for (channel, color) in zip(channels, colors): # compute the histogram for the current channel and plot it hist = cv2.calcHist([channel], [0], mask, [256], [0, 256]) plt.plot(hist, color=color) plt.xlim([0, 256]) # define a mask for our image; black for regions to ignore # and white for regions to examine mask = np.zeros(img.shape[:2], dtype="uint8") cv2.rectangle(mask, (160, 130), (410, 290), 255, -1) # display the masked region masked = cv2.bitwise_and(img, img, mask=mask) # compute a histogram for masked image plot_histogram(img, "Histogram for Masked Image", mask=mask) # show the plots plt.show() cv2.imshow("Mask", mask) cv2.imshow("Mask Image", masked) cv2.waitKey(0)
输出
当您运行上述 Python 程序时,它会生成以下输出窗口 -
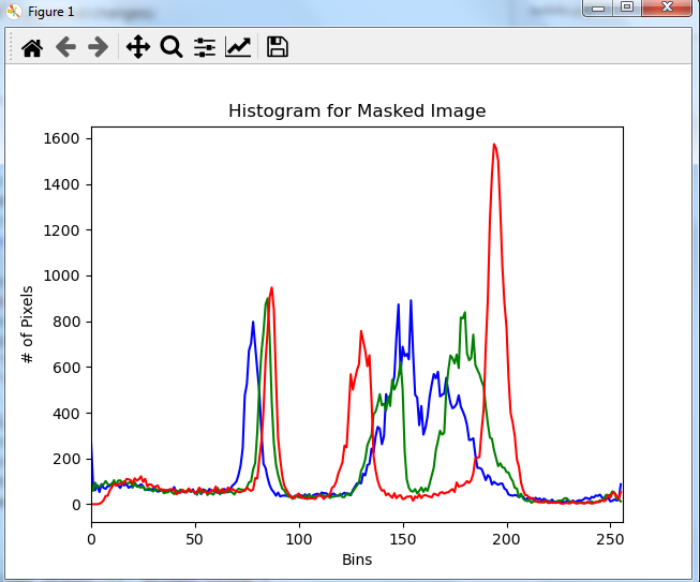
上面的输出图像显示了输入图像中矩形区域的直方图。
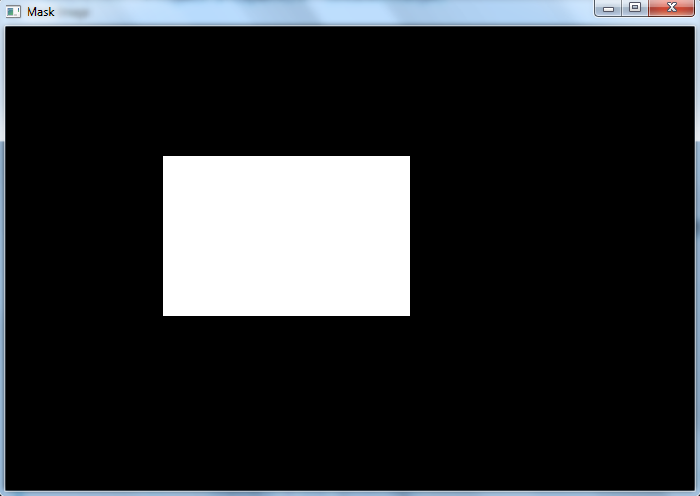
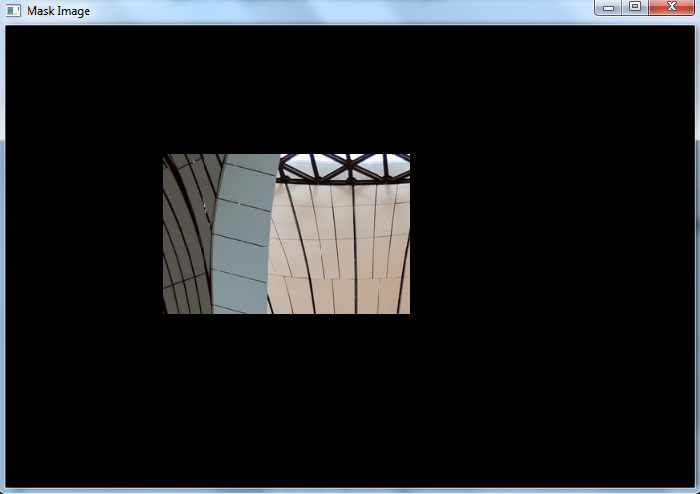
以上两个输出图像是输入图像的遮罩和矩形区域。仅针对此遮罩区域计算直方图。

 浙公网安备 33010602011771号