汽车交易情况分析及价格预测3_搭建模型
一、线性回归
sample_feature = sample_feature.dropna().replace('-', 0).reset_index(drop=True)
sample_feature['notRepairedDamage'] = sample_feature['notRepairedDamage'].astype(np.float32)
train = sample_feature[continuous_feature_names + ['price']]

train_X = train[continuous_feature_names]
train_y = train['price']

model = LinearRegression(normalize=True)

model = model.fit(train_X, train_y)
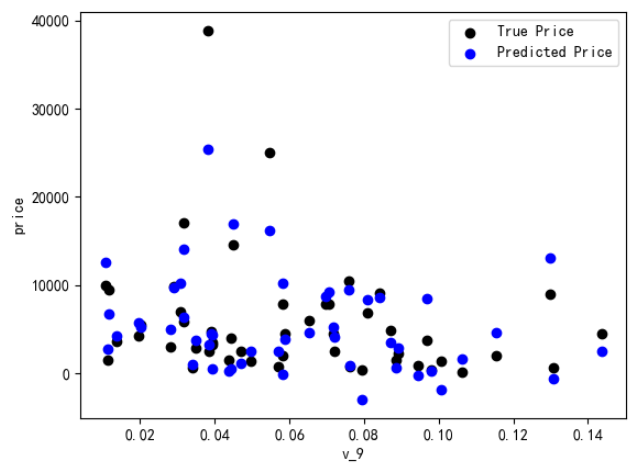
绘制特征v_9的值与标签的散点图,图片发现模型的预测结果(蓝色点)与真实标签(黑色点)的分布差异较大,且部分预测值出现了小于0的情况,说明我们的模型存在一些问题
plt.scatter(train_X['v_9'][subsample_index], train_y[subsample_index], color='black')
plt.scatter(train_X['v_9'][subsample_index], model.predict(train_X.loc[subsample_index]), color='blue')
plt.xlabel('v_9')
plt.ylabel('price')
plt.legend(['True Price','Predicted Price'],loc='upper right')
print('The predicted price is obvious different from true price')
plt.show()
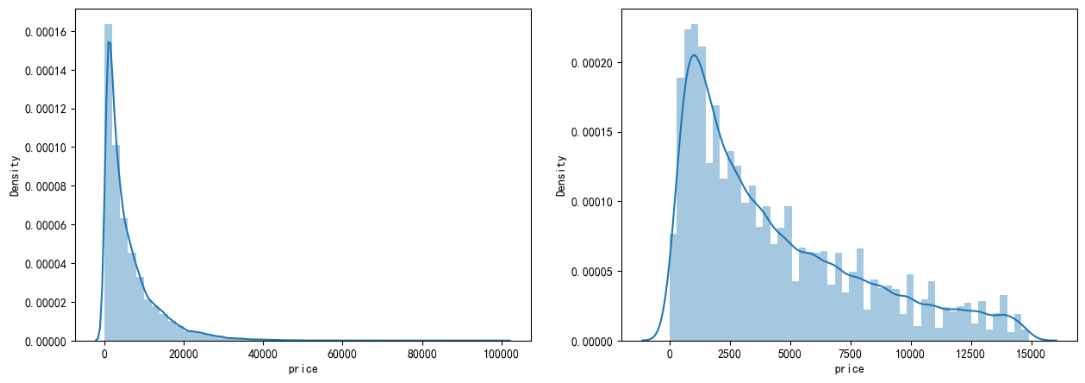
通过作图我们发现数据的标签(price)呈现长尾分布,不利于我们的建模预测。原因是很多模型都假设数据误差项符合正态分布,而长尾分布的数据违背了这一假设。
print('It is clear to see the price shows a typical exponential distribution')
plt.figure(figsize=(15,5))
plt.subplot(1,2,1)
sns.distplot(train_y)
plt.subplot(1,2,2)
sns.distplot(train_y[train_y < np.quantile(train_y, 0.9)])
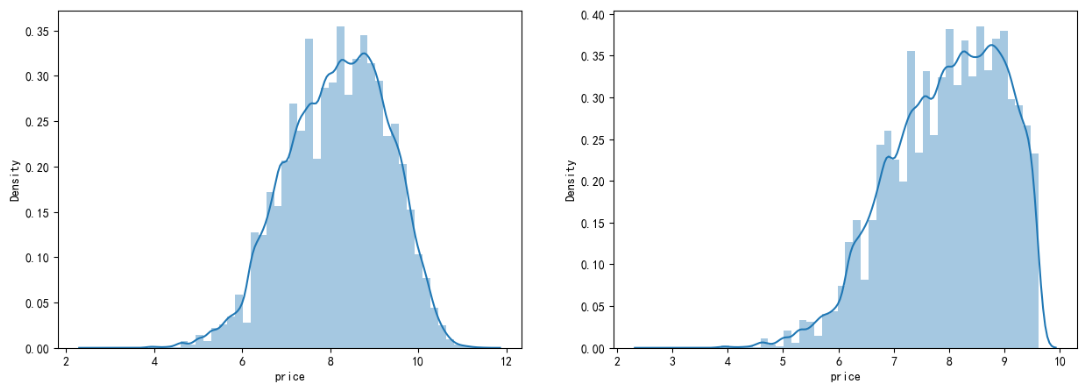
在这里我们对标签进行了对数变换,使标签贴近于正态分布
train_y_ln = np.log(train_y + 1)

import seaborn as sns
print('The transformed price seems like normal distribution')
plt.figure(figsize=(15,5))
plt.subplot(1,2,1)
sns.distplot(train_y_ln)
plt.subplot(1,2,2)
sns.distplot(train_y_ln[train_y_ln < np.quantile(train_y_ln, 0.9)])
再次进行可视化

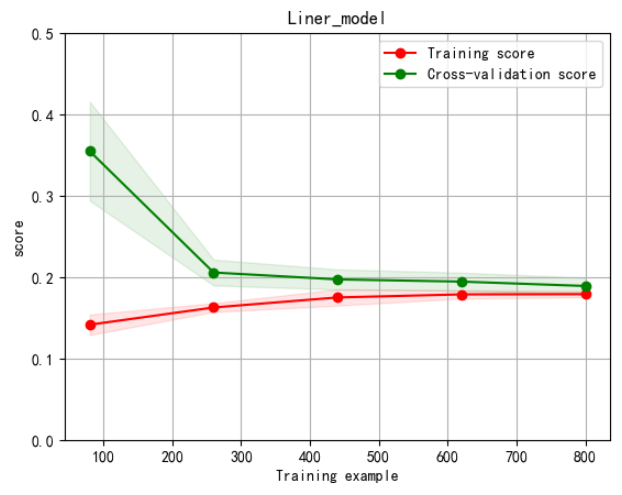
绘制学习率曲线与验证曲线
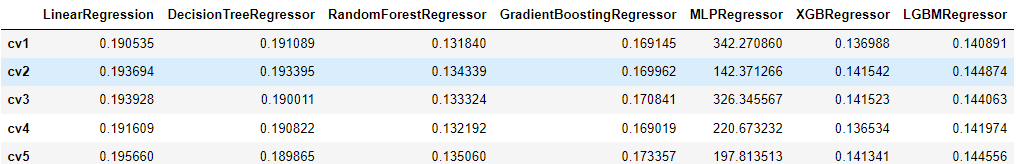
二、非线性模型
models = [LinearRegression(),
DecisionTreeRegressor(),
RandomForestRegressor(),
GradientBoostingRegressor(),
MLPRegressor(solver='lbfgs', max_iter=100),
XGBRegressor(n_estimators = 100, objective='reg:squarederror'),
LGBMRegressor(n_estimators = 100)]


result = dict()
for model in models:
model_name = str(model).split('(')[0]
scores = cross_val_score(model, X=train_X, y=train_y_ln, verbose=0, cv = 5, scoring=make_scorer(mean_absolute_error))
result[model_name] = scores
print(model_name + ' is finished')


result = pd.DataFrame(result)
result.index = ['cv' + str(x) for x in range(1, 6)]
result