ID3决策树算法和BP神经网络算法建立银行分控模型
一.ID3决策树算法
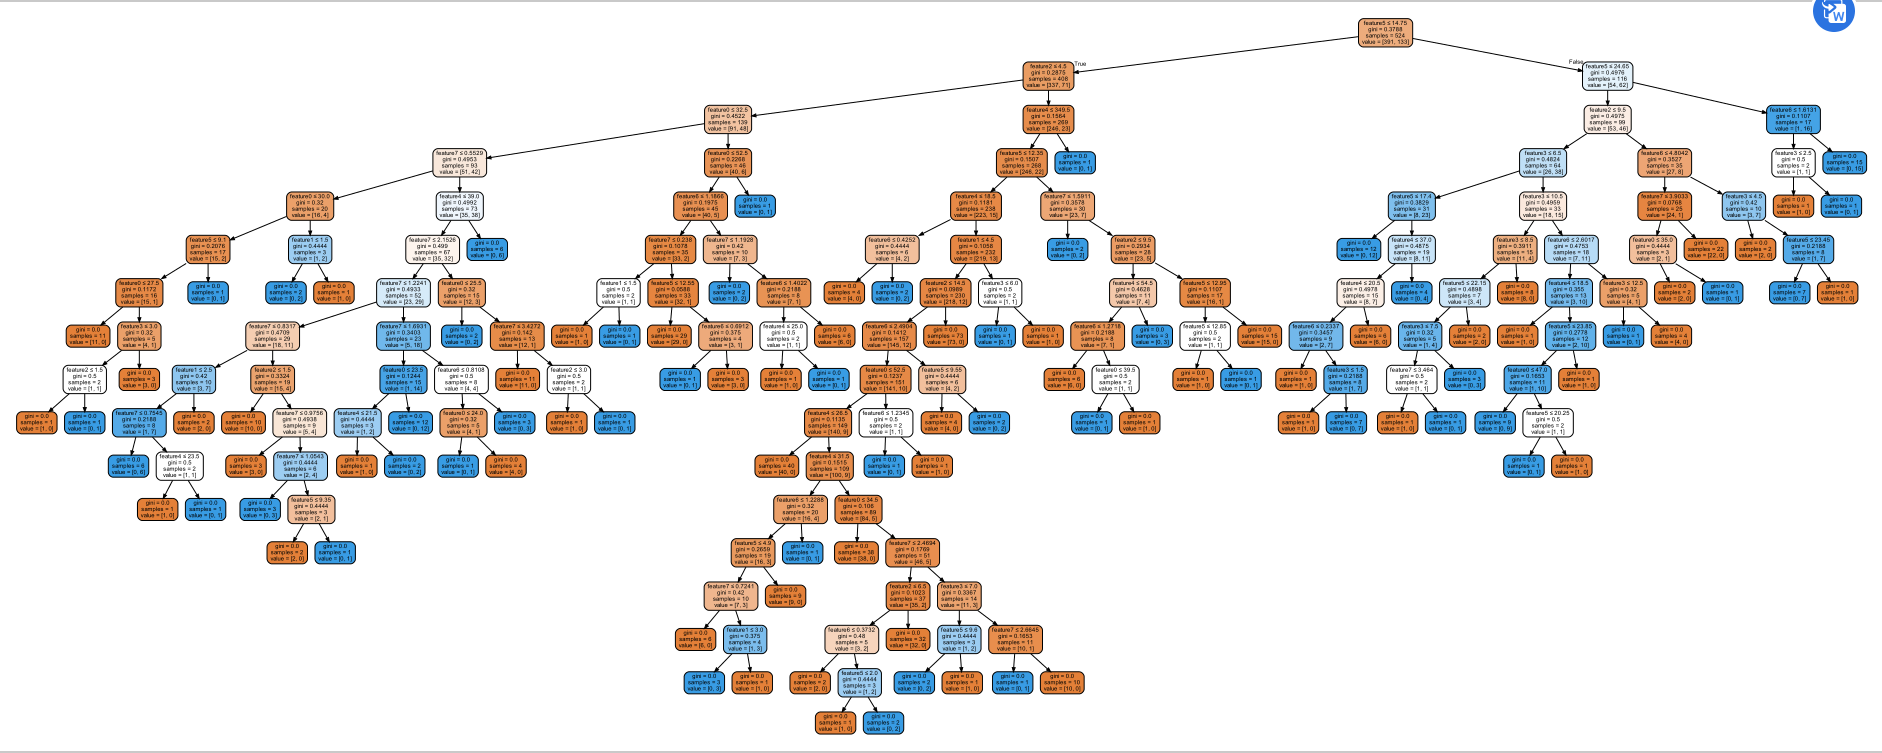
import pandas as pd
from sklearn.model_selection import train_test_split
from sklearn import tree
from sklearn.metrics import precision_recall_curve  #准确率与召回率
import numpy as np
#import graphviz

import os
os.environ["PATH"] += os.pathsep + 'C:/Program Files (x86)/Graphviz/bin/'


def get_data():
    file_path = "data/bankloan.xls"

    data = pd.read_excel(file_path)
    loandata = pd.DataFrame(data)
    ncol = (len(loandata.keys()))
    print(ncol)
    # l = list(data.head(0))  #获取表头
    # print(l)

    feature1 = []
    for i in range(ncol-1):
        feature1.append("feature"+str(i))
    print(feature1)
    iris_x = data.iloc[1:, :ncol-1]#此处有冒号,不显示最后一列
    iris_y = data.iloc[1:,ncol-1]#此处没有冒号,直接定位

    '''计算到底有几个类别'''
    from collections import Counter
    counter = Counter(iris_y)
    con = len(counter)
    print(counter.keys())
    class_names = []
    for i in range(con):
        class_names.append(list(counter.keys())[i])
    x_train, x_test, y_train, y_test = train_test_split(iris_x,iris_y)
    print(x_train)
    print(y_test)
   # return x_train, x_test, y_train, y_test


#def dtfit(x_train, x_test, y_train, y_test):

    clf = tree.DecisionTreeClassifier()
    clf = clf.fit(x_train,y_train)
    predict_data = clf.predict(x_test)
    predict_proba = clf.predict_proba(x_test)
    from sklearn import metrics
    # Do classification task,
    # then get the ground truth and the predict label named y_true and y_pred
    classify_report = metrics.classification_report(y_test, clf.predict(x_test))
    confusion_matrix = metrics.confusion_matrix(y_train, clf.predict(x_train))
    overall_accuracy = metrics.accuracy_score(y_train, clf.predict(x_train))
    acc_for_each_class = metrics.precision_score(y_train,clf.predict(x_train), average=None)
    overall_accuracy = np.mean(acc_for_each_class)
    print(classify_report)


    import pydotplus
    dot_data = tree.export_graphviz(clf, out_file=None,feature_names=feature1, filled=True, rounded=True, special_characters=True,precision = 4)
    graph = pydotplus.graph_from_dot_data(dot_data)
    graph.write_pdf("bankloan.pdf")
    return classify_report


if __name__ == "__main__":
    x = get_data()
    #dtfit(x_train, x_test, y_train, y_test)
二、BP神经网络
import pandas as pd
from keras.models import Sequential
from keras.layers.core import Dense, Activation
import numpy as np


#读取数据
data = data = pd.read_excel('data/bankloan.xls')
x = data.iloc[:,:8].values
y = data.iloc[:,8].values

#建立模型
model = Sequential()
model.add(Dense(input_dim = 8, units = 16))
model.add(Activation('relu'))  #用relu函数作为激活函数,能够大幅提供准确度
model.add(Dense(input_dim = 16, units = 1))
model.add(Activation('sigmoid'))  #由于是0-1输出,用sigmoid函数作为激活函数
model.compile(loss = 'mean_squared_error', optimizer = 'adam')
#编译模型。由于我们做的是二元分类,所以我们指定损失函数为binary_crossentropy,以及模式为binary
#另外常见的损失函数还有mean_squared_error、categorical_crossentropy等,请阅读帮助文件。
#求解方法我们指定用adam,还有sgd、rmsprop等可选
model.fit(x, y, epochs = 100, batch_size = 10)  #训练模型

#分类
yp = model.predict(x).reshape(len(y))  # 分类预测
yp = yp.astype(np.int32)

#画出混淆矩阵图
print("混淆矩阵图:\n")
import cm_plot as cp  # 导入自行编写的混淆矩阵可视化函数
cp.cm_plot(y,yp).show()  # 显示混淆矩阵可视化结果

#损失值
score  = model.evaluate(x,y,batch_size=128)  #模型评估
print("分类预测损失值:",score)
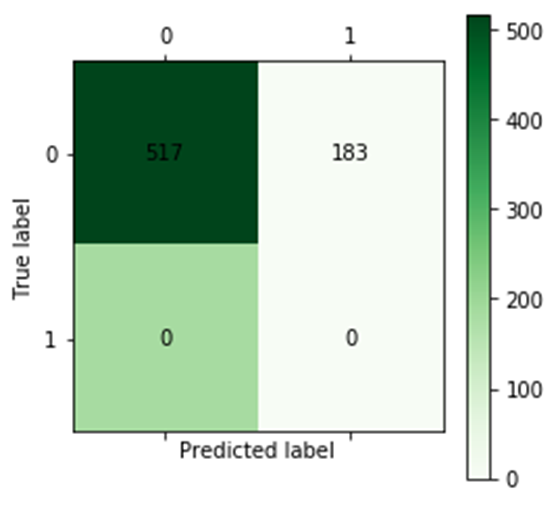
损失值:0.09988928586244583

 浙公网安备 33010602011771号