python数学建模习题六
学号后四位3026,1班
6.1
import networkx as nx
import matplotlib.pyplot as plt
L1 = [(1, 2), (1, 3), (1, 4), (2, 3), (2, 6), (3, 4), (4, 5), (5, 6)]
G1 = nx.Graph();
G1.add_nodes_from(range(1, 7))
G1.add_edges_from(L1);
posl = nx.shell_layout(G1)
plt.subplot(131)
nx.draw(G1, posl, with_labels=True, font_weight='bold')
L2 = [(1, 2, 2.7), (1, 3, 3.0), (1, 4, 12.0), (2, 3, 1.0), (2, 6, 1.0), (3, 4, 8.0), (4, 5, 9.0), (5, 6, 3.0)]
G2 = nx.Graph();
G2.add_nodes_from(range(1, 7))
G2.add_weighted_edges_from(L2);
pos2 = nx.shell_layout(G2)
plt.subplot(132)
nx.draw(G2, pos2, with_labels=True, font_weight='bold')
w2 = nx.get_edge_attributes(G2, 'weight')
nx.draw_networkx_edge_labels(G2, pos2, edge_labels=w2)
L3 = [(1, 3, 3), (2, 1, 7), (2, 3, 1), (3, 4, 8), (4, 1, 12), (5, 4, 9), (5, 6, 3), (6, 2, 1)]
G3 = nx.DiGraph();
G3.add_nodes_from(range(1, 7))
G3.add_weighted_edges_from(L3);
pos3 = nx.shell_layout(G3)
plt.subplot(133)
nx.draw(G3, pos3, with_labels=True, font_weight='bold')
w3 = nx.get_edge_attributes(G3, 'weight')
nx.draw_networkx_edge_labels(G3, pos3, edge_labels=w3)
plt.show()

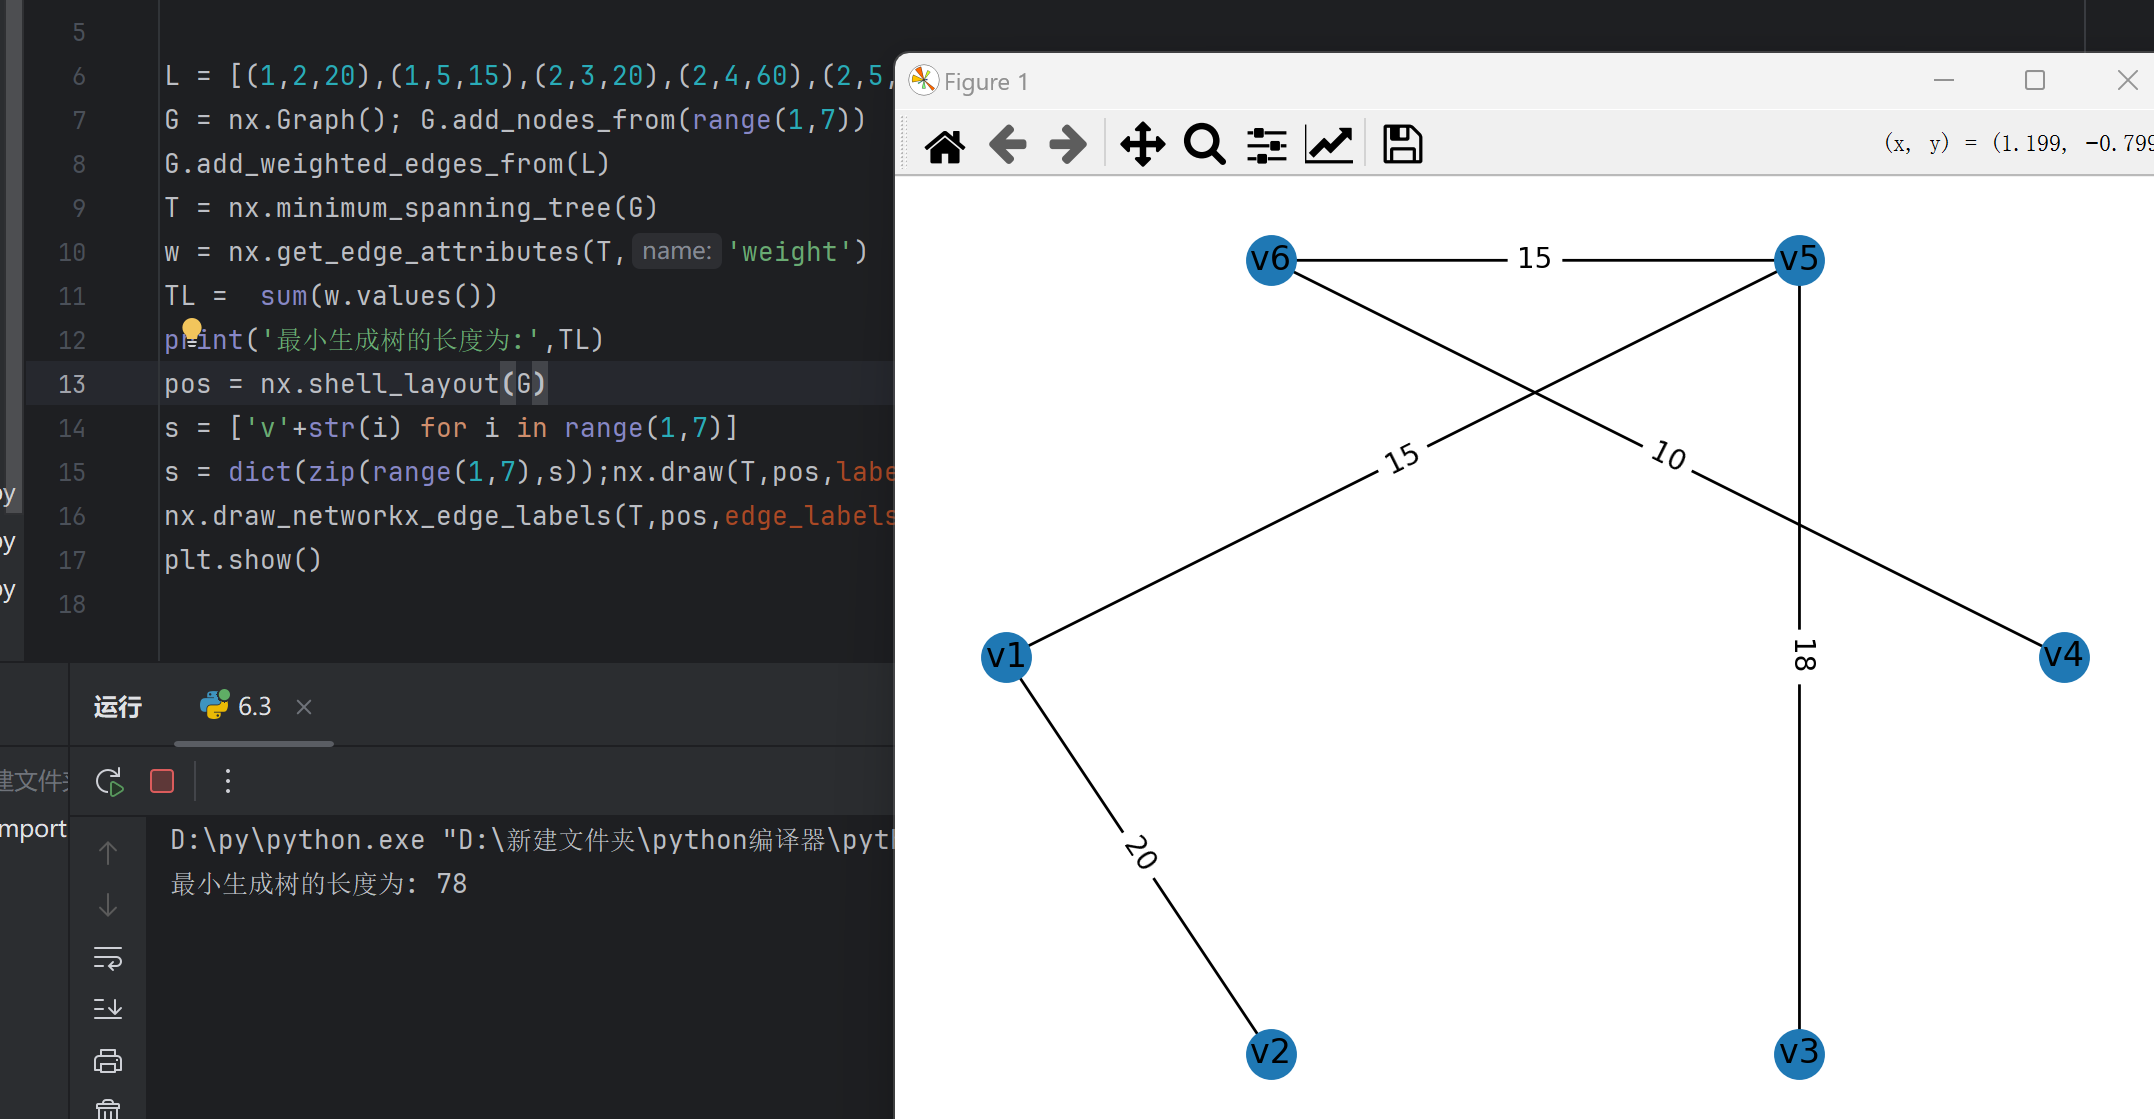
6.3
import numpy as np
import networkx as nx
import matplotlib.pyplot as plt
L = [(1,2,20),(1,5,15),(2,3,20),(2,4,60),(2,5,25),(3,4,30),(3,5,18),(4,5,35),(4,6,10),(5,6,15)]
G = nx.Graph(); G.add_nodes_from(range(1,7))
G.add_weighted_edges_from(L)
T = nx.minimum_spanning_tree(G)
w = nx.get_edge_attributes(T,'weight')
TL = sum(w.values())
print('最小生成树的长度为:',TL)
pos = nx.shell_layout(G)
s = ['v'+str(i) for i in range(1,7)]
s = dict(zip(range(1,7),s));nx.draw(T,pos,labels=s)
nx.draw_networkx_edge_labels(T,pos,edge_labels=w)
plt.show()

6.4
定义初始数据
initial_costs = [2.5, 2.6, 2.8, 3.1] # 年初购置新机器的价格
salvage_values = [0.0, 2.0, 1.6, 1.3, 1.1] # 使用了j年的机器年末的处理价
maintenance_costs = [0.3, 0.8, 1.5, 2.0] # 使用j年的机器每年的运行及维修费用
定义策略函数,计算每种策略的总费用
def calculate_cost(strategy):
total_cost = 0
current_year = 0
machine_age = 0 # 机器当前已使用的年数(从0开始计数)
# 遍历四年的每一年
for _ in range(4):  # 使用for循环代替while循环,因为我们已经知道要遍历四年
    if current_year < len(strategy) and strategy[current_year] == 'new':
        # 如果当前年份有决策且决策是买新机器
        total_cost += initial_costs[current_year]  # 加上新机器的价格
        machine_age = 0  # 重置机器年龄
    else:
        # 否则,继续使用旧机器(或没有机器可用时的特殊情况)
        if machine_age > 0:  # 如果不是第一年(即有机器可用)
            total_cost += salvage_values[machine_age]  # 加上卖掉旧机器的处理价(但注意这里的逻辑可能需要根据实际情况调整)
            # 注意:通常我们不会在继续使用机器的同时卖掉它,这里的处理可能是基于特定假设的

    # 加上当前机器的维修费
    # 注意:我们需要确保machine_age不会超出maintenance_costs的范围,但由于我们已经知道machine_age最大为3(因为只买了三次新机器或从未买过),所以这里不需要额外检查
    total_cost += maintenance_costs[min(machine_age, 3)]

    # 更新机器年龄和年份
    machine_age += 1 if current_year < len(strategy) and strategy[current_year] != 'new' else 0
    current_year += 1

    # 注意:由于我们的策略只定义了前三年的决策,第四年的成本完全基于前三年的决策(特别是机器的年龄)
# 因此,不需要在第四年做额外的决策或计算

return total_cost
定义所有可能的策略(这里只定义了部分策略作为示例)
strategies = [
['new', 'new', 'new'],
['new', 'continue', 'new'],
['new', 'continue', 'continue'],
# 可以添加更多策略...
]
计算每种策略的总费用,并找出最小费用对应的策略
min_cost = float('inf')
best_strategy = None
for strategy in strategies:
cost = calculate_cost(strategy)
if cost < min_cost:
min_cost = cost
best_strategy = strategy
# 输出结果
print(f"最小总费用为:{min_cost} 万元")
print(f"最优更新策略为:{best_strategy}(其中'new'表示买新机器,'continue'表示继续使用上一年的机器到年末)")

6.5
import numpy as np
distance_matrix = np.array([
[0, 10, 20, 30, 40, 50],
[10, 0, 15, 25, 35, 45],
[20, 15, 0, 10, 20, 30],
[30, 25, 10, 0, 15, 25],
[40, 35, 20, 15, 0, 10],
[50, 45, 30, 25, 10, 0]
])
student_counts = np.array([50, 40, 60, 20, 70, 90])
max_distances = np.max(distance_matrix, axis=1)
hospital_location = np.argmin(max_distances) + 1 # 加1是因为村庄编号从1开始
print(f"医院应建在村庄 {hospital_location} 以使最远村庄的人到医院看病所走的路最短。")
total_distances = np.dot(distance_matrix, student_counts)
school_location = np.argmin(total_distances) + 1 # 加1是因为村庄编号从1开始
print(f"小学应建在村庄 {school_location} 以使所有学生上学走的总路程最短。")

6.7
import pandas as pd
import matplotlib.pyplot as plt
import networkx as nx
import numpy as np
读取 Excel 文件
file_path = 'datn4_6.xlsx'
df = pd.read_excel(file_path, header=None)
提取数据
nodes = []
edges = []
for index, row in df.iterrows():
node_id = row[0]
x, y = row[1], row[2]
importance = row[3]
connections = row[4:].dropna().tolist()
nodes.append({'id': node_id, 'x': x, 'y': y, 'importance': importance})

for conn in connections:
    edges.append((node_id, conn))
创建 NetworkX 图
G = nx.Graph()
添加节点和属性
for node in nodes:
importance_symbol = '☆' if node['importance'] == '1' else ('*' if node['importance'] == '2' else ',')
G.add_node(node['id'], pos=(node['x'], node['y']), importance=importance_symbol)
添加边
G.add_edges_from(edges)
绘制无向图
pos = nx.get_node_attributes(G, 'pos')
plt.figure(figsize=(12, 8))
nx.draw_networkx_nodes(G, pos, node_size=500, node_color='skyblue', cmap=plt.cm.RdYlBu, node_shape='o', labels={k: f"{v['importance']}\n{k}" for k, v in G.nodes(data=True)})
nx.draw_networkx_edges(G, pos, alpha=0.5)
nx.draw_networkx_labels(G, pos, font_size=10, font_family="sans-serif")
设置坐标轴范围和刻度
plt.xlim(-1600, 600)
plt.ylim(200, 1200)
plt.xticks(np.arange(-1600, 601, 200))
plt.yticks(np.arange(200, 1201, 200))
plt.grid(True)
plt.gca().set_aspect('equal', adjustable='box')
plt.title('无向图')
plt.xlabel('X 坐标')
plt.ylabel('Y 坐标')
plt.show()
计算最小生成树(权重为距离)
T = nx.minimum_spanning_tree(G, weight=lambda u, v, d: np.sqrt((pos[u][0] - pos[v][0])2 + (pos[u][1] - pos[v][1])2))
绘制最小生成树
plt.figure(figsize=(12, 8))
nx.draw_networkx_nodes(T, pos, node_size=500, node_color='lightgreen', cmap=plt.cm.RdYlBu, node_shape='o', labels={k: f"{v['importance']}\n{k}" for k, v in T.nodes(data=True)})
nx.draw_networkx_edges(T, pos, alpha=0.5, edge_color='red', width=2)
nx.draw_networkx_labels(T, pos, font_size=10, font_family="sans-serif")
设置坐标轴范围和刻度
plt.xlim(-1600, 600)
plt.ylim(200, 1200)
plt.xticks(np.arange(-1600, 601, 200))
plt.yticks(np.arange(200, 1201, 200))
plt.grid(True)
plt.gca().set_aspect('equal', adjustable='box')
plt.title('最小生成树')
plt.xlabel('X 坐标')
plt.ylabel('Y 坐标')
plt.show()
计算顶点 L 到顶点 R3 的最短路径和距离
try:
path = nx.shortest_path(G, source='L', target='R3', weight=lambda u, v, d: np.sqrt((pos[u][0] - pos[v][0])2 + (pos[u][1] - pos[v][1])2))
distance = nx.shortest_path_length(G, source='L', target='R3', weight=lambda u, v, d: np.sqrt((pos[u][0] - pos[v][0])2 + (pos[u][1] - pos[v][1])2))
print(f"顶点 L 到顶点 R3 的最短路径: {path}")
print(f"顶点 L 到顶点 R3 的最短距离: {distance}")
# 绘制最短路径
plt.figure(figsize=(12, 8))
nx.draw_networkx_nodes(G, pos, node_size=500, node_color='skyblue', cmap=plt.cm.RdYlBu, node_shape='o', labels={k: f"{v['importance']}\n{k}" for k, v in G.nodes(data=True)})
nx.draw_networkx_edges(G, pos, alpha=0.5)
nx.draw_networkx_edges(G, pos, edgelist=list(zip(path, path[1:] + [path[0]])), edge_color='blue', width=3)
nx.draw_networkx_labels(G, pos, font_size=10, font_family="sans-serif")

# 设置坐标轴范围和刻度
plt.xlim(-1600, 600)
plt.ylim(200, 1200)
plt.xticks(np.arange(-1600, 601, 200))
plt.yticks(np.arange(200, 1201, 200))
plt.grid(True)
plt.gca().set_aspect('equal', adjustable='box')
plt.title('最短路径')
plt.xlabel('X 坐标')
plt.ylabel('Y 坐标')
plt.show()
except nx.NetworkXNoPath:
print("顶点 L 到顶点 R3 之间没有路径")


