echarts仪表盘带有进度条、有指针会动效果

使用前需要引入百度echarts插件,可以通过www.lizicat.com下载.echarts.js
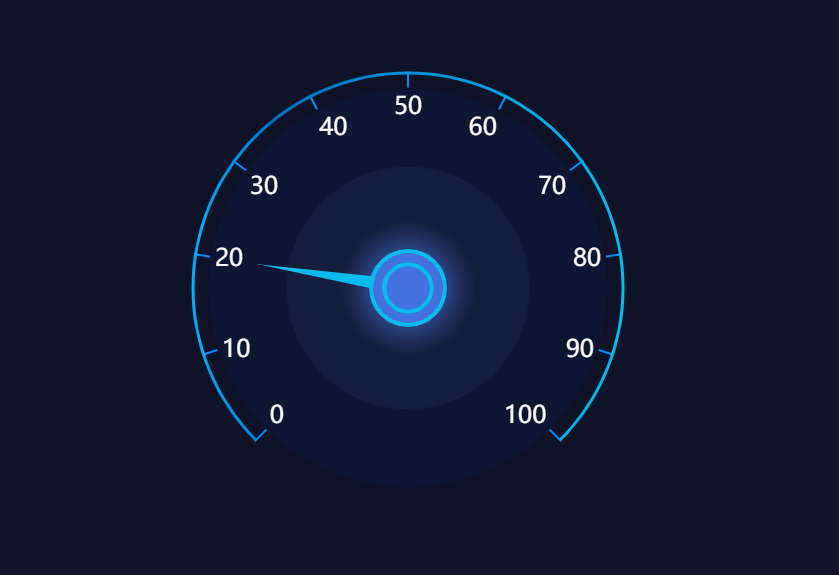
具体效果如下:


 参考代码。

var color = new echarts.graphic.LinearGradient(0, 0, 1, 0, [{
        offset: 0,
        color: "#00B0FF", // 0% 处的颜色
    },
    {
        offset: 0.2,
        color: "#0071CB", // 100% 处的颜色
    },
    {
        offset: 1,
        color: "#08BBED", // 100% 处的颜色
    },
]);

var bgColor = new echarts.graphic.LinearGradient(0, 0, 0, 1, [{
        offset: 0,
        color: "#00B0FF00", // 0% 处的颜色
    },
    {
        offset: 1,
        color: "#0073FF33", // 100% 处的颜色
    },
]);

var colorSet = [
    [1, color]
];

var option = {
    // backgroundColor: bgColor,
    backgroundColor: "#0E1327",
    tooltip: {
        formatter: "{a} <br/>{b} : {c}%",
    },
    series: [{
            radius: "50%",
            splitNumber: 10,
            name: "",
            z: 10,
            type: "gauge",
            detail: {
                show: false,
            },
            data: [{
                value: 20,
            }, ],
            axisTick: {
                show: false,
            },
            splitLine: {
                show: false,
            },
            max: "100",
            axisLine: {
                lineStyle: {
                    width: 3,
                    color: colorSet,
                },
            },
            axisLabel: {
                show: false,
            },
            pointer: {
                // 表盘上的指针
                show: true,
                length: "70%",
            },
            itemStyle: {
                // 表盘指针的颜色
                color: "#08BBED",
            },
        },
        {
            name: "白色圈刻度",
            type: "gauge",
            radius: "50%",
            startAngle: 225, //刻度起始
            endAngle: -45, //刻度结束
            min: 0,
            max: 100,
            splitNumber: 10,
            z: 8,
            axisTick: {
                show: false,
            },
            splitLine: {
                length: 16, //刻度节点线长度
                lineStyle: {
                    width: 2,
                    color: "#018DFF",
                }, //刻度节点线
            },
            axisLabel: {
                color: "rgba(255,255,255,8)",
                fontSize: 24,
            }, //刻度节点文字颜色
            pointer: {
                show: false,
            },
            axisLine: {
                lineStyle: {
                    opacity: 0,
                },
            },
            detail: {
                show: false,
            },
            data: [{
                value: 0,
                name: "",
            }, ],
        },
        {
            name: "内外圆",
            type: "pie",
            radius: ["28%", "46%"],
            z: 5,
            itemStyle: {
                color: "rgba(0,49,154,0.1)",
            },
            hoverAnimation: false,
            label: {
                show: false,
            },
            tooltip: {
                show: false,
            },
            data: [100],
            animationType: "scale",
        },
        {
            //内圆
            name: "内外圆-渐变",
            type: "pie",
            radius: "28%",
            z: 0,
            itemStyle: {
                normal: {
                    color: new echarts.graphic.RadialGradient(
                        0.5,
                        0.5,
                        0.7,
                        [{
                                offset: 0,
                                color: "#4978EC",
                            },
                            {
                                offset: 0.32,
                                color: "#1E2B57",
                            },
                            {
                                offset: 0.4,
                                color: "#141F3D",
                            },
                            {
                                offset: 1,
                                color: "#141F3D",
                            },
                        ],
                        false
                    ),
                    label: {
                        show: false,
                    },
                    labelLine: {
                        show: false,
                    },
                },
            },
            hoverAnimation: false,
            label: {
                show: false,
            },
            tooltip: {
                show: false,
            },
            data: [100],
            animationType: "scale",
        },
        {
            name: "小圆形",
            type: "pie",
            hoverAnimation: false,
            legendHoverLink: false,
            tooltip: {
                show: false,
            },
            radius: ["8%", "9%"],
            z: 10,
            label: {
                normal: {
                    show: false,
                    position: "center",
                },
                emphasis: {
                    show: false,
                },
            },
            labelLine: {
                normal: {
                    show: false,
                },
            },
            data: [{
                value: 100,
                name: "2",
                itemStyle: {
                    normal: {
                        color: colorSet,
                    },
                },
            }, ],
        },
        {
            name: "小圆形",
            type: "pie",
            hoverAnimation: false,
            legendHoverLink: false,
            radius: ["0%", "5%"],
            tooltip: {
                show: false,
            },
            z: 10,
            label: {
                normal: {
                    show: false,
                    position: "center",
                },
                emphasis: {
                    show: false,
                },
            },
            labelLine: {
                normal: {
                    show: false,
                },
            },
            data: [{
                value: 100,
                name: "2",
                itemStyle: {
                    normal: {
                        color: "#4672e0",
                    },
                },
            }, ],
        },
        {
            name: "小圆形",
            type: "pie",
            hoverAnimation: false,
            legendHoverLink: false,
            radius: ["5%", "6%"],
            tooltip: {
                show: false,
            },
            z: 10,
            label: {
                normal: {
                    show: false,
                    position: "center",
                },
                emphasis: {
                    show: false,
                },
            },
            labelLine: {
                normal: {
                    show: false,
                },
            },
            data: [{
                value: 100,
                name: "2",
                itemStyle: {
                    normal: {
                        color: "#08BBED",
                    },
                },
            }, ],
        },
        {
            name: "小圆形",
            type: "pie",
            hoverAnimation: false,
            legendHoverLink: false,
            tooltip: {
                show: false,
            },
            radius: ["6%", "8%"],
            z: 10,
            label: {
                normal: {
                    show: false,
                    position: "center",
                },
                emphasis: {
                    show: false,
                },
            },
            labelLine: {
                normal: {
                    show: false,
                },
            },
            data: [{
                    value: 0,
                    name: "1",
                    itemStyle: {
                        normal: {
                            color: "red",
                        },
                    },
                },
                {
                    value: 100,
                    name: "2",
                    itemStyle: {
                        normal: {
                            color: "#4672e0",
                        },
                    },
                },
            ],
        },
        // {
        //     name: "底部圆弧",
        //     radius: "50%",
        //     center: ["50%", "110%"],
        //     z: 30,
        //     type: "gauge",
        //     detail: {
        //         show: false,
        //     },
        //     axisTick: {
        //         show: false,
        //     },
        //     splitLine: {
        //         show: false,
        //     },
        //     axisLine: {
        //         lineStyle: {
        //             width: 3,
        //             color: colorSet,
        //         },
        //     },
        //     axisLabel: {
        //         show: false,
        //     },
        //     pointer: {
        //         // 表盘上的指针
        //         show: false,
        //     },
        //     itemStyle: {
        //         // 表盘指针的颜色
        //         show: false,
        //     },
        // },
        // {
        //     type: "pie",
        //     z: 0,
        //     center: ["50%", "146%"],
        //     radius: [0, "100%"],
        //     data: [1],
        //     labelLine: {
        //         show: false,
        //     },
        //     itemStyle: {
        //         color: {
        //             type: "radial",
        //             x: 0.5,
        //             y: 0.5,
        //             r: 0.5,
        //             colorStops: [{
        //                     offset: 0.8,
        //                     color: "transparent",
        //                 },
        //                 {
        //                     offset: 1,
        //                     color: "rgba(0,136,255,0.4)",
        //                 },
        //             ],
        //         },
        //     },
        // },
    ]
};


posted @ 2020-07-06 10:36  imcrony  阅读(3389)  评论(0编辑  收藏  举报