echartsjs双X轴标签对应(非等分情况),区县比例柱状图
使用的时候需要引入百度echartsjs.js文件
效果图
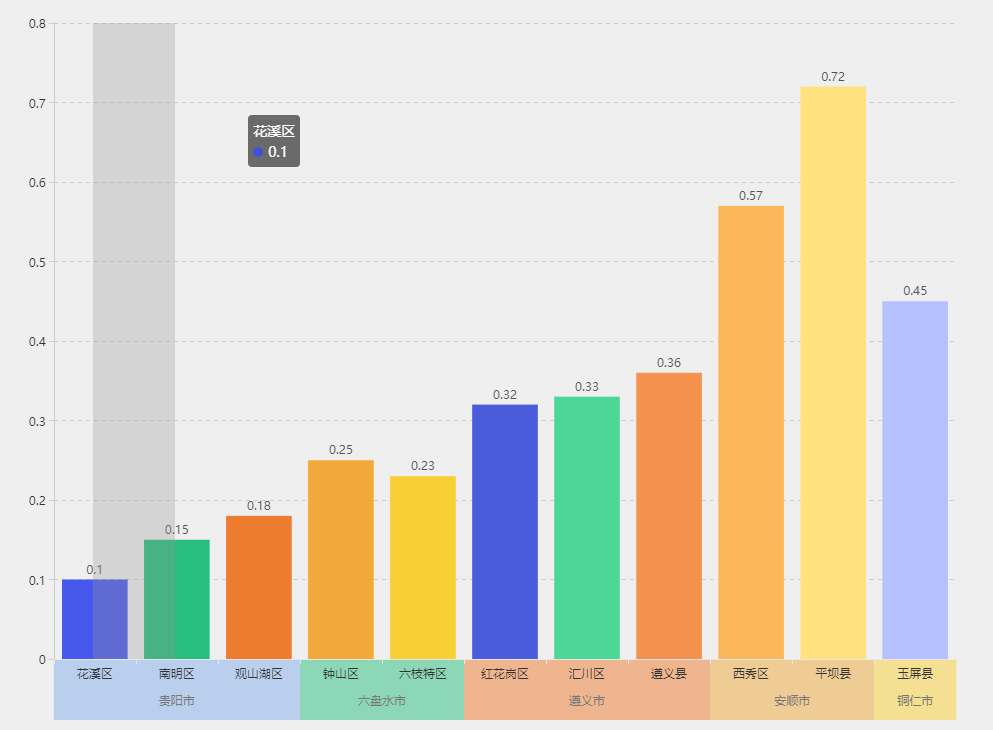
let data = {
    xData: ['花溪区', '南明区', '观山湖区', '钟山区', '六枝特区', '红花岗区', '汇川区', '遵义县', '西秀区', '平坝县', '玉屏县'],
    yData: [0.1, 0.15, 0.18, 0.25, 0.23, 0.32, 0.33, 0.36, 0.57, 0.72, 0.45]
}
/**
    双X轴标签对应,伪实现思路:
    底部的标签也是柱状图,对应包含的区域为上方X轴条数占总数的比例,设为宽度即可
*/
option = {
    tooltip: {
        trigger: 'axis',
        axisPointer: {
            type: 'shadow'
        }
    },
    grid: [
        {
            top: 100,
            bottom: 101
        },
        {
            height: 60,
            bottom: 40
        }
    ],
    xAxis: [{
        type: 'category',
        data: data.xData,
        gridIndex: 0,
        axisLabel: {
            color: '#333'
        },
        axisLine: {
            lineStyle: {
                color: '#e7e7e7'
            }
        },
        axisTick: {
            lineStyle: {
                color: '#e7e7e7'
            }
        },
        zlevel: 2
    }, {
        type: 'category',
        gridIndex: 1,
        axisLine: {
            show: false
        },
        zlevel: 1
    }],
    yAxis: [{
        type: 'value',
        gridIndex: 0,
        axisLabel: {
            color: '#333'
        },
        splitLine: {
            lineStyle: {
                type: 'dashed'
            }
        },
        axisLine: {
            lineStyle: {
                color: '#ccc'
            }
        },
        axisTick: {
            lineStyle: {
                color: '#ccc'
            }
        }
    },{
        type: 'value',
        gridIndex: 1,
        axisLabel: {
            show: false
        },
        axisLine: {
            show: false
        },
        splitLine: {
            show: false
        },
        axisTick: {
            show: false
        }
    }],
    series: [{
        data: data.yData,
        type: 'bar',
        label: {
            show: true,
            position: 'top',
            textStyle: {
                color: '#555'
            }
        },
        itemStyle: {
            normal: {
                color: (params) => {
                    let colors = ['#4150d8', '#28bf7e', '#ed7c2f', '#f2a93b', '#f9cf36', '#4a5bdc', '#4cd698', '#f4914e', '#fcb75b', '#ffe180', '#b6c2ff', '#96edc1']
                    return colors[params.dataIndex]
                }
            }
        },
        xAxisIndex: 0,
        yAxisIndex: 0
    },{
        data: [{
            name: '贵阳市',
            value: 1
        }],
        label: {
            show: true,
            position: 'inside',
            formatter: '{b}',
            offset: [0, 10],
            textStyle: {
                color: '#777'
            }
        },
        type: 'bar',
        barGap: 0,
        barWidth: '27.2727%',
        itemStyle: {
            normal: {
                color: 'rgba(134,176,237, .5)'
            }
        },
        xAxisIndex: 1,
        yAxisIndex: 1
    },{
        data: [{
            name: '六盘水市',
            value: 1
        }],
        label: {
            show: true,
            position: 'inside',
            formatter: '{b}',
            offset: [0, 10],
            textStyle: {
                color: '#777'
            }
        },
        type: 'bar',
        barGap: 0,
        barWidth: '18.1818%',
        itemStyle: {
            normal: {
                color: 'rgba(40,191,126, .5)'
            }
        },
        xAxisIndex: 1,
        yAxisIndex: 1
    },{
        data: [{
            name: '遵义市',
            value: 1
        }],
        label: {
            show: true,
            position: 'inside',
            formatter: '{b}',
            offset: [0, 10],
            textStyle: {
                color: '#777'
            }
        },
        type: 'bar',
        barGap: 0,
        barWidth: '27.2727%',
        itemStyle: {
            normal: {
                color: 'rgba(237,124,47, .5)'
            }
        },
        xAxisIndex: 1,
        yAxisIndex: 1
    },{
        data: [{
            name: '安顺市',
            value: 1
        }],
        label: {
            show: true,
            position: 'inside',
            formatter: '{b}',
            offset: [0, 10],
            textStyle: {
                color: '#777'
            }
        },
        type: 'bar',
        barGap: 0,
        barWidth: '18.1818%',
        itemStyle: {
            normal: {
                color: 'rgba(242,169,59, .5)'
            }
        },
        xAxisIndex: 1,
        yAxisIndex: 1
    },{
        data: [{
            name: '铜仁市',
            value: 1
        }],
        label: {
            show: true,
            position: 'inside',
            formatter: '{b}',
            offset: [0, 10],
            textStyle: {
                color: '#777'
            }
        },
        type: 'bar',
        barCategoryGap: 0,
        barGap: 0,
        barWidth: '9.0909%',
        itemStyle: {
            normal: {
                color: 'rgba(249,207,54, .5)'
            }
        },
        xAxisIndex: 1,
        yAxisIndex: 1
    }]
};

 浙公网安备 33010602011771号