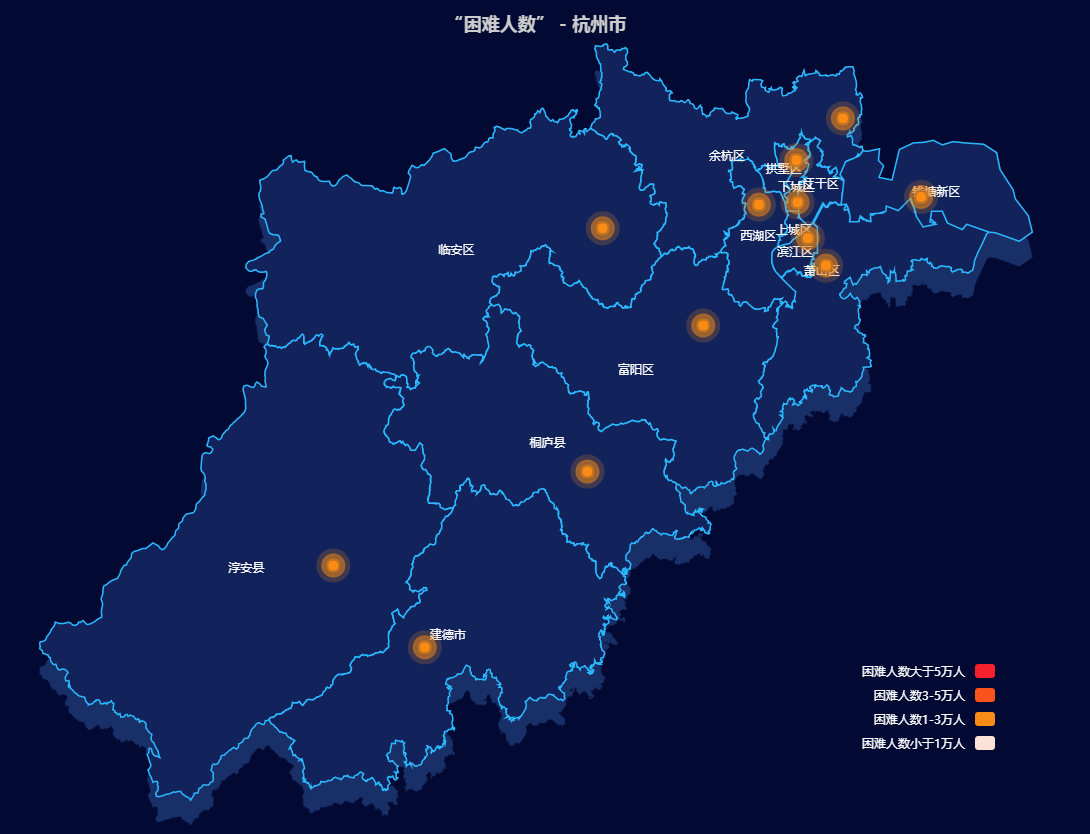
echarts杭州市地图“困难人数”类型人物数量占比统计
页面需要引入百度echarts插件。
var uploadedDataURL = "/asset/get/s/data-1591343795436-TgLtkd9hN.json";可以使用阿里云提供的地图数据

/**
此版本通过设置geoindex && seriesIndex: [1] 属性来实现geo和map共存,来达到hover散点和区域显示tooltip的效果

默认情况下,map series 会自己生成内部专用的 geo 组件。但是也可以用这个 geoIndex 指定一个 geo 组件。这样的话,map 和 其他 series(例如散点图)就可以共享一个 geo 组件了。并且,geo 组件的颜色也可以被这个 map series 控制,从而用 visualMap 来更改。
当设定了 geoIndex 后,series-map.map 属性,以及 series-map.itemStyle 等样式配置不再起作用,而是采用 geo 中的相应属性。

http://echarts.baidu.com/option.html#series-map.geoIndex

并且加了pin气泡图标以示数值大小
*/

// var uploadedDataURL = "/asset/get/s/data-1482909892121-BJ3auk-Se.json";
myChart.showLoading();
      let index = -1;
      var timer = setInterval(function() {
        // 隐藏提示框
        myChart.dispatchAction({
          type: 'hideTip',
          seriesIndex: 0,
          dataIndex: index
        });
        // 显示提示框
        myChart.dispatchAction({
          type: 'showTip',
          seriesIndex: 0,
          dataIndex: index + 1
        });
        // 取消高亮指定的数据图形
        myChart.dispatchAction({
          type: 'downplay',
          seriesIndex: 0,
          dataIndex: index
        });
        // 高亮指定的数据图形
        myChart.dispatchAction({
          type: 'highlight',
          seriesIndex: 0,
          dataIndex: index + 1
        });
        index++;
        if (index > 13) {
          index = -1;
        }
      }, 2000);


      myChart.on('mousemove', function(e) {
        clearInterval(timer);
        myChart.dispatchAction({
          type: 'downplay',
          seriesIndex: 0
        });
        myChart.dispatchAction({
          type: 'highlight',
          seriesIndex: 0,
          dataIndex: e.dataIndex
        });
        myChart.dispatchAction({
          type: 'showTip',
          seriesIndex: 0,
          dataIndex: e.dataIndex
        });
      }); //---------------------------------------------鼠标移入静止播放
      myChart.on('mouseout', function(e) {
        clearInterval(timer);
        myChart.dispatchAction({
          type: 'downplay',
          seriesIndex: 0,
          dataIndex: e.dataIndex
        }); //鼠标移出后先把上次的高亮取消
        timer = setInterval(function() {
          // 隐藏提示框
          myChart.dispatchAction({
            type: 'hideTip',
            seriesIndex: 0,
            dataIndex: index
          });
          // 显示提示框
          myChart.dispatchAction({
            type: 'showTip',
            seriesIndex: 0,
            dataIndex: index + 1
          });
          // 取消高亮指定的数据图形
          myChart.dispatchAction({
            type: 'downplay',
            seriesIndex: 0,
            dataIndex: index
          });
          // 高亮指定的数据图形
          myChart.dispatchAction({
            type: 'highlight',
            seriesIndex: 0,
            dataIndex: index + 1
          });
          index++;
          if (index > 13) {
            index = -1;
          }
        }, 2000);
      });
$.getJSON(uploadedDataURL, function(geoJson) {

    echarts.registerMap('hanzhou', geoJson);
    myChart.hideLoading();
 var mapDate = [
      {
        name: '江干区',
        value: [120.185, 30.274,29999]
      },
      {
        name: '拱墅区',
        value: [120.182, 30.351,29999]
      },
      {
        name: '西湖区',
        value: [120.091, 30.27,29999]
      },
      {
        name: '滨江区',
        value: [120.21, 30.209,29999]
      },
      {
        name: '萧山区',
        value: [120.254, 30.159,29999]
      },
      {
        name: '余杭区',
        value: [120.295, 30.427,29999]
      },
      {
        name: '富阳区',
        value: [119.956, 30.05,29999]
      },
      {
        name: '桐庐县',
        value: [119.675, 29.784,29999]
      },
      {
        name: '淳安县',
        value: [119.058, 29.613,29999]
      },
      {
        name: '建德市',
        value: [119.28, 29.464,29999]
      },
      {
        name: '临安区',
        value: [119.712, 30.227,29999]
      },
      {
        name: '钱塘新区',
        value: [120.485, 30.284,29999]
      }
    ];


    option = {
        backgroundColor: '#020933',
        title: {
            top: 20,
            text: '“困难人数” - 杭州市',
            subtext: '',
            x: 'center',
            textStyle: {
                color: '#ccc'
            }
        },

        // tooltip: {
        //     trigger: 'item',
        //     formatter: function(params) {
        //         console.log(params)
        //             return params.name + ' : ' + params.value[2];
        //     }
        // },
       visualMap: {
          min: 0,
          max: 1000000,
          right: 100,
          seriesIndex: 1,
          type: 'piecewise',
          bottom: 100,
          textStyle: {
            color: '#FFFF'
          },
          splitList: [
            {
              gt: 50000,
              color: '#F5222D',
              label: '困难人数大于5万人'
            }, //大于5万人
            {
              gte: 30000,
              lte: 50000,
              color: '#FA541C ',
              label: '困难人数3-5万人'
            }, //3-5万人
            {
              gte: 10000,
              lte: 30000,
              color: '#FA8C16',
              label: '困难人数1-3万人'
            }, //1-3万人
            {
              lte: 10000,
              color: '#fbe1d6',
              label: '困难人数小于1万人'
            }
          ]
        },

        geo: {
            map: 'hanzhou',
          aspectScale: 0.75, //长宽比
          zoom: 1.1,
          roam: false,
          itemStyle: {
            normal: {
              areaColor: '#013C62',
              shadowColor: '#182f68',
              shadowOffsetX: 0,
              shadowOffsetY: 25
            },
            emphasis: {
              areaColor: '#2AB8FF',
              borderWidth: 0,
              color: 'green',
              label: {
                show: false
              }
            }
          }
        },
        series: [ {
            type: 'map',
            roam: true,
            label: {
              normal: {
                show: true,
                textStyle: {
                  color: '#fff'
                }
              },
              emphasis: {
                textStyle: {
                  color: '#fff'
                }
              }
            },

            itemStyle: {
              normal: {
                borderColor: '#2ab8ff',
                borderWidth: 1.5,
                areaColor: '#12235c'
              },
              emphasis: {
                areaColor: '#2AB8FF',
                borderWidth: 0,
                color: 'green'
              }
            },
            zoom: 1.1,
            roam: false,
            map: 'hanzhou' //使用
            // data: this.difficultData //热力图数据   不同区域 不同的底色
          },
          {
            type: 'effectScatter',
            coordinateSystem: 'geo',
            showEffectOn: 'render',
            rippleEffect: {
              period: 15,
              scale: 4,
              brushType: 'fill'
            },
            hoverAnimation: true,
            itemStyle: {
              normal: {
                color: '#ffff',
                shadowBlur: 10,
                shadowColor: '#333'
              }
            },
            data: mapDate
          }

        ]
    };
    myChart.setOption(option);
});
具体效果如下:

 浙公网安备 33010602011771号