Winform mschart 动态绑定X时间表
效果图:
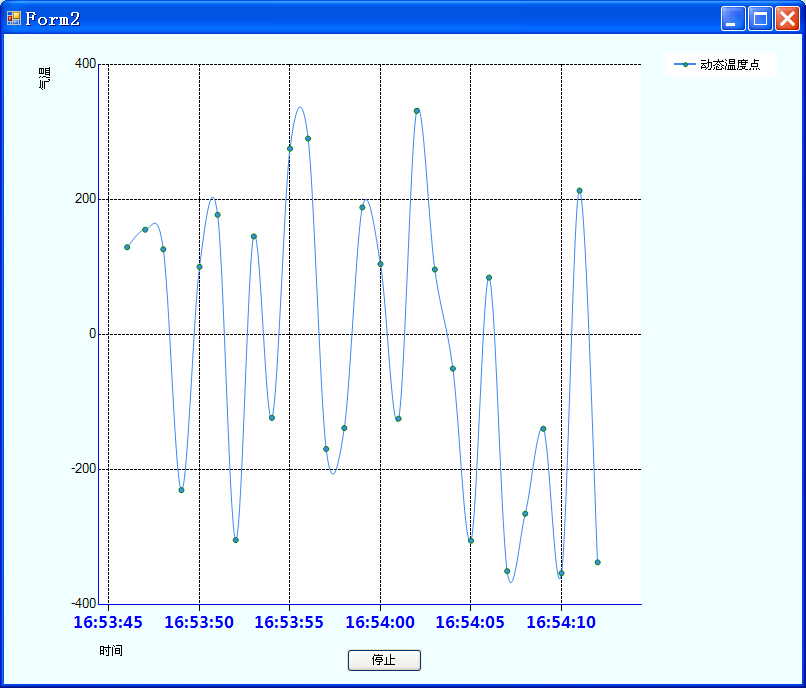
代码:
using System;
using System.Collections.Generic;
using System.ComponentModel;
using System.Data;
using System.Drawing;
using System.Text;
using System.Windows.Forms;
using System.Windows.Forms.DataVisualization.Charting;
using System.Threading;

//动态画图方式四 曲线压缩模式
namespace Krypton440Test
{
    public partial class Form2 : Form
    {

        static DateTime startTime = DateTime.Now.AddSeconds(-1);
        DateTime endTime = startTime.AddSeconds(6);
        DateTime kd = DateTime.Parse("00:00:01");
        Random rd = new Random();       //随机函数,产生Y轴数据
        DataTable dt = new DataTable(); //创建数据表,存储数据
        int flag = 0;   //设置Timer控件是否生效
        int i = 0;      //显示数据表中的数据行数

        private void timer1_Tick(object sender, EventArgs e)
        {
            DataRow dr = dt.NewRow();
            dr["XTime"] = DateTime.Now.ToString("HH:mm:ss");
            dr["YTemp"] = rd.Next(-360, 360);
            dt.Rows.Add(dr);

            #region 折线图
            mychart.DataSource = dt;//绑定数据
            mychart.Series["Series1"].ChartType = SeriesChartType.Spline;//设置图表类型
            mychart.Series["Series1"].IsValueShownAsLabel = false;//显示数据点的值
            mychart.Series["Series1"].BorderColor = Color.Green;
            mychart.Series["Series1"].LegendText ="动态温度点";
            mychart.Series["Series1"].MarkerStyle = MarkerStyle.Circle; //线条上的数据点标志类型


            i = dt.Rows.Count - 1;
            mychart.Series[0].Points.AddXY(Convert.ToDateTime(dt.Rows[i]["XTime"].ToString()).ToOADate(), Convert.ToDouble(dt.Rows[i]["YTemp"].ToString()));

            //X轴设置
            mychart.ChartAreas["ChartArea1"].AxisX.Title = "时间";//X轴标题
            mychart.ChartAreas["ChartArea1"].AxisX.TitleAlignment = StringAlignment.Near;//设置X轴标题的名称所在位置位近
            mychart.ChartAreas["ChartArea1"].AxisX.MajorTickMark.Enabled = true; //坐标轴上的刻度线
            mychart.ChartAreas["ChartArea1"].AxisX.MajorGrid.Enabled = true;//不显示竖着的分割线
            mychart.ChartAreas["ChartArea1"].AxisX.MajorGrid.LineDashStyle = ChartDashStyle.Dash;//主网格为虚线
            mychart.ChartAreas["ChartArea1"].AxisX.LineColor = Color.Blue; //X轴颜色
            this.mychart.ChartAreas["ChartArea1"].AxisX.IsMarksNextToAxis = true;
            this.mychart.ChartAreas["ChartArea1"].AxisX.LabelStyle.IsEndLabelVisible = true;//最后一个标签点显示

            //设置X轴字体类型、大小、颜色
            this.mychart.ChartAreas["ChartArea1"].AxisX.LabelStyle.Font = new System.Drawing.Font("微软雅黑", 12f, System.Drawing.FontStyle.Bold);
            this.mychart.ChartAreas["ChartArea1"].AxisX.LabelAutoFitMaxFontSize = 12;
            this.mychart.ChartAreas["ChartArea1"].AxisX.LabelStyle.ForeColor = Color.Blue;


            /************************************************************************/
            /* 本文重点讲解时间格式的设置
             * 但第一个点并不能保证在原点第一个时间坐标位置,与时间间隔跨度有关系
             * 需要设置最小时间,最大小时,时间间隔类型,时间间隔值等四个参数,以保证当前网络跨度内容显示6个主网络线*/
            /************************************************************************/
            mychart.Series["Series1"].XValueType = ChartValueType.DateTime;     //X轴标签为时间类型
            mychart.ChartAreas["ChartArea1"].AxisX.LabelStyle.Format = "HH:mm:ss";  //X轴上显示时、分、秒

            if (DateTime.Now.ToOADate() > endTime.ToOADate())
            {
                endTime = endTime.AddSeconds(6);//延长X时间轴

                //设置时间单位的最小、最大值
                this.mychart.ChartAreas["ChartArea1"].AxisX.Minimum = startTime.ToOADate();
                this.mychart.ChartAreas["ChartArea1"].AxisX.Maximum = endTime.ToOADate();

                //跨度为秒,间隔是通过最大时间与最小时间差相减除6所得,所以有6个间隔线
                this.mychart.ChartAreas["ChartArea1"].AxisX.IntervalType = DateTimeIntervalType.Seconds;
                TimeSpan jianGe = endTime - startTime;
                this.mychart.ChartAreas["ChartArea1"].AxisX.Interval = (jianGe.TotalSeconds) / 6;
            }


            //Y轴设置
            mychart.ChartAreas["ChartArea1"].AxisY.Title = "气温";//Y轴标题
            mychart.ChartAreas["ChartArea1"].AxisY.TitleAlignment = StringAlignment.Far;//设置Y轴标题的名称所在位置位远
            mychart.ChartAreas["ChartArea1"].AxisY.Interval = 200;
            mychart.ChartAreas["ChartArea1"].AxisY.Maximum = 400;
            mychart.ChartAreas["ChartArea1"].AxisY.Minimum = -400;
            mychart.ChartAreas["ChartArea1"].AxisY.MajorTickMark.Enabled = false;//坐标轴上的刻度线,为false时少了小横杆线
            mychart.ChartAreas["ChartArea1"].AxisY.MajorGrid.LineDashStyle = ChartDashStyle.Dash;
            mychart.ChartAreas["ChartArea1"].AxisY.LineColor = Color.Blue;
            #endregion

        }


        public Form2()
        {
            InitializeComponent();
        }

        private void Form2_Load(object sender, EventArgs e)
        {
            //清空原来数据缓存
            mychart.Series["Series1"].Points.Clear();

            //设置Chart大小
            mychart.Width = Width - 100;
            mychart.Height = Height - 100;
            mychart.BackColor = Color.Azure;
            dt.Columns.Add("XTime", System.Type.GetType("System.String"));
            dt.Columns.Add("YTemp", System.Type.GetType("System.String"));
        }

        private void button1_Click(object sender, EventArgs e)
        {
            if (flag % 2 == 0)
            {
                timer1.Enabled = false;
            }
            else
            {
                timer1.Enabled = true;
            }
            flag++;
        }
    }
}
