Python基于皮尔逊系数实现股票预测
 1 # -*- coding: utf-8 -*-
 2 """
 3 Created on Mon Dec  2 14:49:59 2018
 4
 5 @author: zhen
 6 """
 7
 8 import matplotlib.pyplot as plt
 9 import numpy as np
10 import pandas as pd
11 from datetime import datetime
12
13 def normal(a):  #最大值最小值归一化
14     return (a - np.min(a)) / (np.max(a) - np.min(a)+0.000001)
15
16 def normalization(x): # np.std:计算矩阵的标准差(方差的算术平方根)
17     return (x - np.mean(x)) / np.std(x)
18
19 def corrcoef(a,b):
20     corrc = np.corrcoef(a,b) # 计算皮尔逊相关系数,用于度量两个变量之间的相关性,其值介于-1到1之间
21     corrc = corrc[0,1]
22     return (16 * ((1 - corrc) / (1 + corrc)) ** 1) # ** 表示乘方
23
24 startTimeStamp = datetime.now() # 获取当前时间
25 # 加载数据
26 filename = 'C:/Users/zhen/.spyder-py3/sh000300_2017.csv'
27 # 获取第一,二列的数据
28 all_date = pd.read_csv(filename,usecols=[0, 1, 3], dtype = 'str')
29 all_date = np.array(all_date)
30 data = all_date[:, 0]
31 times = all_date[:, 1]
32
33 data_points = pd.read_csv(filename,usecols=[3])
34 data_points = np.array(data_points)
35 data_points = data_points[:,0] #数据
36
37 topk = 10 #只显示top-10
38 baselen = 100
39 basebegin = 361
40 basedata = data[basebegin]+' '+times[basebegin]+'~'+data[basebegin+baselen-1]+' '+times[basebegin+baselen-1]
41 base = data_points[basebegin:basebegin+baselen]#一天的数据是240个点
42 length = len(data_points) #数据长度
43
44 # 分割片段
45 subseries = []
46 dateseries = []
47 for j in range(0,length):
48     if (j < (basebegin - baselen) or j > (basebegin + baselen - 1)) and j <length - baselen:
49         subseries.append(data_points[j:j+baselen])
50         dateseries.append(j) #开始位置
51
52 # 片段搜索
53 listdistance = []
54 for i in range(0, len(subseries)):
55     tt = np.array(subseries[i])
56     distance = corrcoef(base, tt)
57     listdistance.append(distance)
58
59 # 排序
60 index = np.argsort(listdistance,kind='quicksort') #排序,返回排序后的索引序列
61
62 # 显示,要匹配的数据
63 plt.figure(0)
64 plt.plot((base),label = basedata, linewidth='2')
65 plt.legend(loc='upper left')
66 plt.title('Base data')
67
68 # 原始数据
69 plt.figure(1)
70 num = index[0]
71 length = len(subseries[num])
72 begin = data[dateseries[num]]+' '+times[dateseries[num]]
73 end = data[dateseries[num]+length-1]+' '+times[dateseries[num]+length-1]
74 label = begin+'~'+end
75 plt.plot((subseries[num]), label=label, linewidth='2')
76 plt.legend(loc='upper left')
77 plt.title('Similarity data')
78
79 # 结果集对比
80 plt.figure(2)
81 plt.plot(normalization(base),label= basedata,linewidth='2')
82 length = len(subseries[num])
83 begin = data[dateseries[num]] + ' ' + times[dateseries[num]]
84 end = data[dateseries[num] + length - 1] + ' ' + times[dateseries[num] + length - 1]
85 label = begin + '~' + end
86 plt.plot(normalization(subseries[num]), label=label, linewidth='3')
87 plt.legend(loc='lower right')
88 plt.title('normal similarity search')
89 plt.show()
90
91 endTimeStamp=datetime.now()
92 print('run time', (endTimeStamp-startTimeStamp).seconds, "s")
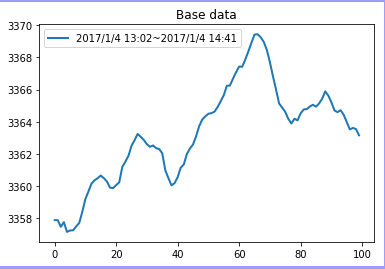
结果: